Cover page
Student name: John C Gibson
Course number: PHYS.1410L , Section 811
Instructor name: Benjamin MacConnell
Date of experiment: Sep 27, 2023
Partner’s name: Nate Farl, R. Mac Millan
Title of experiment:
Projectile Motion
Objective: Measuring a projectile motion under earth’s gravity acceleration. Using a spring power cannon with pre-determined initial projectile velocity to check the projectile’s maximum travel time, distance, and height. Using the accepted earth gravity acceleration value to compare and evaluate experimental factors affecting real motion.
Introduction
Earth's gravity force affects all moving objects near Earth with acceleration g according to Newton’s section law of motion f=ma , where f is Earth’s gravitational force, m is the mass of an object, and a is acceleration. Earth exerts force on objects exactly proportional to mass, so a is a constant. And, a is denoted g when the earth’s gravitational force is concerned.
The accepted g value is 9.8 m/s2 . In our chosen coordinate system on the right, g is negative from the displacement y-axis. So, g=-9.8 m/s2 .
The height of travel equation for free fall due to gravity acceleration is
y = y0y+ v0y t + 1/2a t2
, where y0y is the starting point displacement from the origin,
v0y is the initial velocity of the object, y0y=0 because we place the cannon that shoots out a steel ball at the origin, t is time, a = -g , which is acceleration by gravity. So, we rewrite it as
y = v0y t - 1/2g t2 Equation 1
. The distance of travel equation for free fall is
x = x0x+ v0x t + 1/2a t2
, where x0x is the starting point displacement from the origin, v0x is the initial velocity of the object, and t is time.
But there is very little horizontal force acceleration by air resistance with a very dense and small steel ball compared to gravity, so we set a=0 , x0y=0 because we place the cannon that shoots out the steel ball at the origin. So, we rewrite the equation as
x = v0x t Equation 2
. Likewise, there is very little vertical force acceleration by air resistance compared to gravity g. So, we set all acceleration “a” calculation with accepted value g=-9.8 m/s2 .
Derivation:
To obtain the theoretical maximum height ymax of the projectile motion curve, according to calculus, the first derivative of y(t) should be 0 at a local maxim of y(t), meaning the slope of the y(t) curve at the maxima is 0,
dy(t)dt=0 ddt(v0y t - 1/2g t2)=0
v0y- g t=0 t=voyg
Using Equation 1 of y displacement with the above t value,
y = v0y voyg - 1/2g (voyg)2= v0y2g-1/2v0y2g =v0y22g
, but voy=vosin , so, y=v0y2/2g=(vosin)2/2g.
To obtain the theoretical flight time t from Equation 1, y is 0 when the steel ball lands at the same height as the starting point,
0= v0yt - 1/2g t2 v0yt= 1/2g t2 v0y=1/2gt
t=2v0y/g t=2vosin/g .
To obtain the theoretical flight distance x from Equation 2, substitute t with the derived 2vosin/g,
x = v0x2vosin/g=vocos2vosin/g =v022sincos/g
, however, according to trigonometry identity 2sincos=sin(2), so x is v02sin(2)/g.
To obtain the theoretical height y at x horizontal displacement, substitute t in Equation 1 with Equation 2’s
x = v0x t t=x/v0x
, y = v0yx/v0x - 1/2g (x/v0x)2=tanx-gx2/2v0x= tanx-(g/(2v02cos2))x2 Equation 3.
Steps
Measure the initial velocity of the steel ball out of the spring-powered cannon for the short range.
Measure the initial velocity of the steel ball out of the spring-powered cannon for the medium range.
Measure the initial velocity of the steel ball out of the spring-powered cannon for the long range.
Clamp the spring-powered cannon with 10 degrees of incline with the long-range firing power.
Move the lab jack with impression ink paper above the impact timer detection patch to the theoretical flight distance x meters forward of the cannon.
Clamp a 1.5-meter ruler vertically to the lab bench forward x/2 meters of the cannon.
Reset the computerized timer.
Lab partner A stands in front of the vertical ruler.
Lab partner B prepares to catch the cannon behind the lab jack with the landing patch.
Fire the steel ball with the cannon.
Repeat 7 times from step 4 but increase the incline angle by 10 degrees each time until measurements for 80 degrees incline are reached.
Clamp the cannon adjacent to the whiteboard, 80cm wide with 1cm grid lines. Prepare it for short-range firing.
Start video recording with a smartphone aiming at and centered at the whiteboard.
Fire the steel ball.
Apparatus and Procedure
Complete list of equipment
Labeled block diagram of each part of the experiment
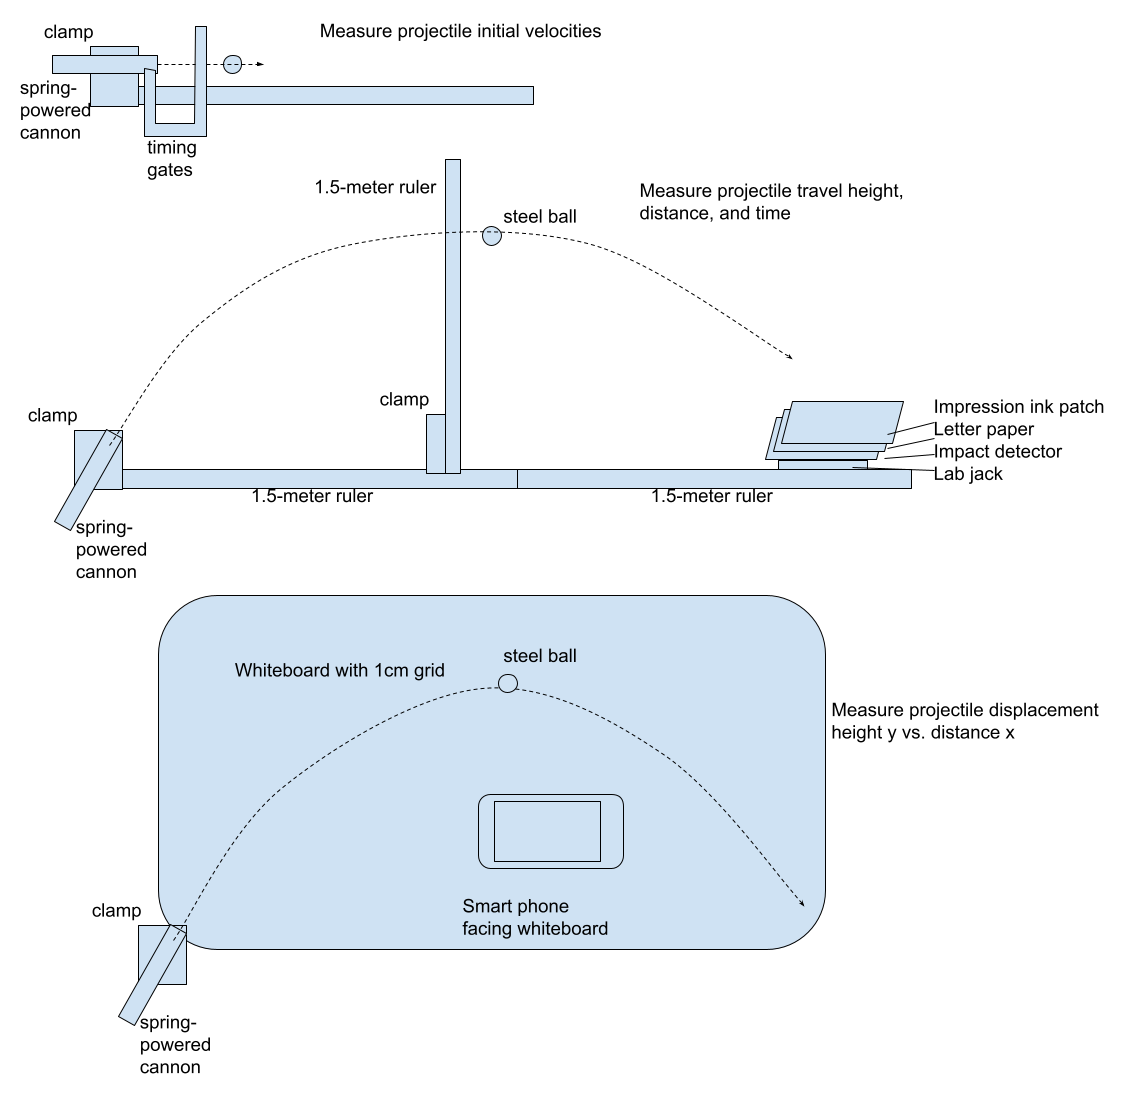
Describe the experiment
Measure the initial velocity of the steel ball out of the spring-powered cannon for the short range.
Clamp the cannon at 0 degrees incline. Load the steel ball with 1 click of the spring latch.
Open the computerized timer and select the gate velocity window. Click Start, then pull the trigger, then click Stop. Repeat 3 times. Record the velocity in Table 1.
Measure the initial velocity of the steel ball out of the spring-powered cannon for the medium range.
Clamp the cannon at 0 degrees incline. Load the steel ball with 2 clicks of the spring latch.
Open the computerized timer and select the gate timing window. Click Start, then pull the trigger, then click Stop. Repeat 3 times. Record the velocity in Table 1.
Measure the initial velocity of the steel ball out of the spring-powered cannon for the long range.
Clamp the cannon at 0 degrees incline. Load the steel ball with 3 clicks of the spring latch.
Open the computerized timer and select the gate timing window. Click Start, then pull the trigger, then click Stop. Repeat 3 times. Record the velocity in Table 1.
Clamp the spring-powered cannon with 10 degrees of incline with the long-range firing power.
Adjust the height so that the mouth of the cannon is at 0cm verticle level.
Move the lab jack with impression ink paper above the impact timer detection patch to the theoretical flight distance x meters forward of the cannon.
The theoretical travel distance x is v02sin(2)/g . Calculate this value and move the lab jack accordingly.
Clamp a 1.5-meter ruler vertically to the lab bench forward x/2 meters of the cannon.
This distance is half of step 5’s distance. So the ruler is right in the middle between the cannon and the landing patch.
Reset the computerized timer.
Open the computerized timer and select the timing window. Click Stop, then Start.
Lab partner A stands in front of the vertical ruler.
This partner needs to record the maximum height y.
Lab partner B prepares to catch the cannon behind the lab jack with the landing patch.
This partner also measures the horizon travel distance with the impact ink mark using horizontal rulers.
Fire the steel ball with the cannon.
Catch the steel ball and click Stop in the computer timing app. Record the time, maximum height, travel distance in Table 2.
Repeat 7 times from step 4, but increase the incline angle by 10 degrees each time until measurements for 80 degrees incline are reached.
Clamp the cannon adjacent to the whiteboard, 80cm wide with 1cm grid lines. Prepare it for short-range firing.
The incline angle is 70 degrees for this experiment.
Start video recording with a smartphone aiming at and centered at the whiteboard.
Fire the steel ball.
Stop the video recording. Playback the video and watch the x distance with the corresponding y height, starting at 0cm x distance, increasing 5cm x distance for each entry of the record. Save record data in Table 3.
Results and Analysis
The recorded short, medium, and long-range initial velocity v0 , as well as the average of the measured values are shown in the following Table 1.
Table 1.
Sample calculation for the short range: v0 = (3.29+3.29+3.30)/3 = 3.29 m/s.
The recorded result t, x, Ymax, and theoretical calculated, t=2v0sin/g , x=2v02sin2/g , and ymax=(v0sin)2/2g, are shown in the following Table 2.
Table 2.
Sample calculation for angle=10 degrees,
Theoretical 2v0 sinθ/g (s) = 2 * 5.60 * sin(10) / 9.8 = 0.20s .
Theoretical v0^2 sin2θ/g (m) = 5.60^2 * sin(2*10) / 9.8 = 1.09 m.
Theoretical (v0 sinθ)^2 / 2g (m) = (5.60*sin(10))^2 / (2*9.8) = 0.048m.
Graphically, the recorded flight time t and theoretical calculated time are shown in the following Graph1.

Graph 1.
The recorded flight range x and theoretical calculated range are shown in the following Graph2.

Graph 2.
The recorded flight maximum height Ymax and theoretical calculated maximum height are shown in below Graph 3.

Graph 3.
The recorded trajectory x vs. y displacement is shown in the following Table 3 and Graph 4.

Table 3 Graph 4
Sample calculation theoretical y at x=0.05m: tan(70)*0.05-(9.8/(2*3.29^2*cos(70)^2))*0.05^2=0.137-0.01=0.13m
Analysis
As shown in the above Table 1 of initial projectile velocities, the short-range initial velocity is lower than the medium-range initial velocity, and the medium-range initial velocity is lower than the long-range initial velocity.
As shown in the above “time of flight vs. launch angle” Graph 1, the time of flight increases with increasing incline of the cannon. The measured flight time is slightly lower than the theoretical flight time.
As shown in the above “range vs. launch angle” Graph 2, the travel distance increases with increasing incline of the cannon from 10 degrees to 45 degrees. However, the travel distance decreases with increasing incline of the cannon from 45 degrees to 80 degrees. The measured flight time is sometimes slightly lower or higher than the theoretical flight time.
As shown in the above “maximum height vs. launch angle” Graph 3, the maximum height of flight increases with increasing incline of the cannon. The measured maximum height is slightly lower than the theoretical value.
As shown in the above “trajectory x position vs. y position” Graph 4, the projectile travels in a parabola curve. The measured displacements x and y are slightly lower than the theoretical value for all measured points.
All measured data points are close to theoretical calculation.
Discussion
Compared to theory
As shown in the above “time of flight vs. launch angle” Graph 1, the measured flight time trend line is slightly lower than the theoretical flight time, likely due to air resistance.
As shown in the above “range vs. launch angle” Graph 2, the measured flight time trend line is sometimes slightly lower or higher than the theoretical flight time, likely due to a slight shift of firing angle when pulling the cannon’s trigger.
As shown in the above “maximum height vs. launch angle” Graph 3, the measured maximum height trend line is slightly lower than the theoretical value, likely due to air resistance.
As shown in the above “trajectory x position vs. y position” Graph 4, the measured displacements x and y are slightly lower than the theoretical value for all measured points, likely due to air resistance.
All my experiment result errors are likely due to air resistance and the slight shift of firing angle when pulling the cannon’s trigger.
Uncertainty
The rulers have a 1mm precision. However, when estimating the maximum travel height of the steel ball, it is ascertained while the ball is flying. So, the uncertainty can be higher than 1mm.
Difficulties
The air resistance and the slight shift of firing angle when pulling the cannon’s trigger are the difficulties of the experiment.
Conclusion
My experimental measured data points in Graph 1 through Graph 4 are pretty close to calculated theoretical values.
My experiment was a success.
Restatement of the objection of this experiment is to use pre-determined initial velocities v0 of a projectile to measure and compare the trajectory, flight time, travel distance, maximum height, and displacement relation between orthogonal axis. The objection is to check whether theoretical equations fit observed data, and it is shown that theoretical equations do fit observed data pretty well.
The objection is achieved. My experiment was a success.
Questions
Consider a scenario where the experiment is conducted on the Moon. Assume that the Moon has the same air atmosphere. How would the reduced gravity affect the projectile's trajectory?
For the first part of the experiment (determining v0), the projectile is fired in the horizontal position, which has no change of horizontal forces because both the earth's and moon’s gravities point downward at the vertical axis. So, the experiment on the Moon will have the same result as Earth’s v0 for all short, medium, and long-range firings.
For the second part of the experiment (determining X, Ymax, and t), according to the derived 3 equations,
Ymax=(vosin)2/2g
t=2vosin/g
x =v02sin(2)/g
, all 3 values are inversely proportional to gravity acceleration. So, all 3 measurements on all inclination eagles should be larger if the experiment is done on the Moon. The moon’s gravity acceleration is about 16.6% of the earth’s gravity acceleration. So, all measured 3 values should be about 1/16.6% = 6.0 times larger. Flight time 6 times longer, traveling 6 times farther, and reaching 6 times higher points.
For the third part of the experiment, the Equation 3
y = tanx-(g/(2v02cos2))x2
can be viewed in 2 parts with the 2 terms. For the first term
tanx
, y and x both will be 6 times as large. For the second term
(g/(2v02cos2))x2
, g will be 6 times smaller, but x^2 will be 6^2=36 times larger, so the second term will be 36/6=6 times larger.
So, overall, the entire Graph 4, projectile displacement x versus y, will be 6 times larger, both in the x-axis and y-axis.
No comments:
Post a Comment