Cover page
Student name: John C Gibson
Course number: PHYS.1410L , Section 811
Instructor name: Benjamin MacConnell
Date of experiment: Nov 29, 2023
Partner’s name: (No partner)
Title of experiment:
Rotational Dynamics
Objective: Measure a rotating object’s angular velocity change under external and friction torque. In addition, collision characteristics will be examined with angular momentum, specifically the conservation of angular momentum.
Introduction
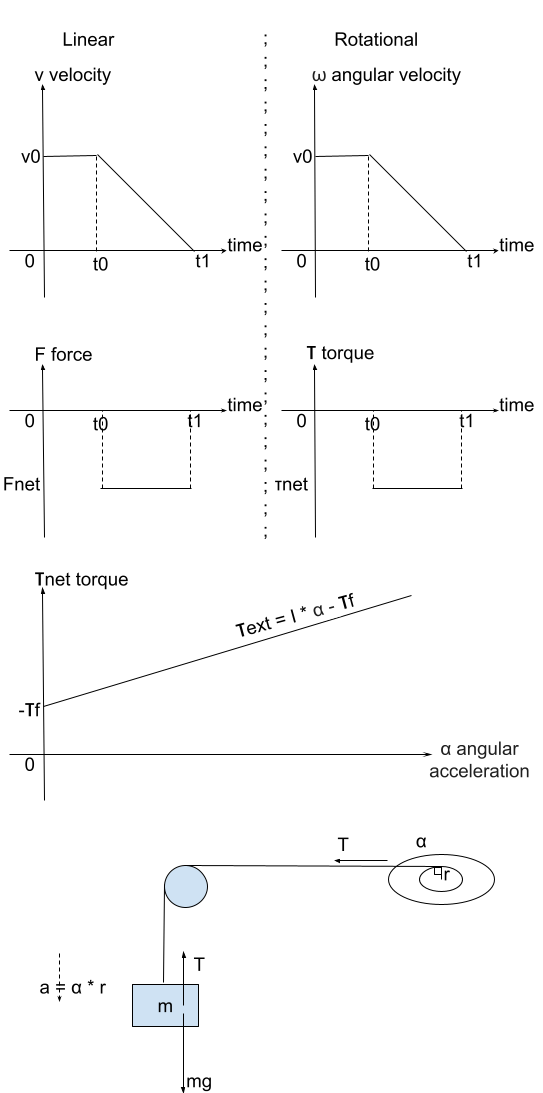
The rotational dynamics of a system are parallel and analogous to linear dynamics in Newton’s second law of the force equation,
F=ma ; τ=Iα
, where α is angular acceleration, and I is the moment of inertia. The parallel is illustrated on the right for a constant net force or a constant net torque.
For the simplest case of a rotating object of an unknown moment of inertia I, but with a known constant net torque, we can calculate the object’s moment of inertia by dividing both sides of the equation of the second law by angular acceleration.
I=τ/α
The example force can be friction, which is a negative vector in the opposite direction of rotation.
I=f/f Equation 6.
When the net torque is composed of 2 forces, friction, and external,
net=f+ext
, substitute torque of the second law equation,
f+ext=Iα
, and subtract both sides with f, we obtain a linear curve of the relationship between ext and α.
ext=Iα-f Equation 11.
Because f is expected to be in the opposite direction of rotational angular velocity direction,
f is negative
, the plot of ext, as shown on the right has a positive intersect on the vertical axis (the α-axis), because the relationship equation has negative sign for the friction torque f. Two negatives make a positive.
Derivation:
As shown in the force diagram on the right, the α-versus-net data collection needs 4 fields,
Applied Mass m, Angular Acceleration of the rotating body, Cord Tension T, and Applied Torque τ.
The weight m of the object in the force diagram above gives rise to the force of the torque. However, cord tension T is smaller than the gravitational force mg because the weight object is itself accelerating downward with a=α*r . The overall force (mg - T) produces the downward acceleration a=α*r .
mg-T = ma=m(αr)
mg-m(αr)=T
m(g-αr)=T
The tension T on the weigh object m is exactly the tension T that pulls the rotational object.
Torque is obtained from a gravitational force multiplied by the radius of action by vector cross product. The angle between the 2 vectors is 90 degrees, sin(90)=1.
τ=T·rsin()=Tr
So, the overall table of data to collect has the following 4 fields.
The theoretical moment of inertia for a flat platter is given as 1/2 * mass * radius ^2 ;
the theoretical moment of inertia for a flat ring is given as 1/2 * mass * (InnerRadius^2 + OuterRadius^2).
The momentum of rotation L is analogous to liner moment P=mv.
L=Iω
When external torque on a rotational system is zero, angular momentum is also conserved.
Lin=Lfin
Steps
Start by setting up the data connection between the computer program and the angular position/velocity detector.
There are 3 parts of the experiment.
Measure the friction torque and mass of rotation objects.
Place the platter on the rotation axis and turn the platter, and click Collect in the computer velocity detection program to measure the velocity time course.
After 30 seconds, the velocity detection program automatically stops.
Take a screenshot of the velocity time course.
Repeat from step 1 three times to get the average angular acceleration.
Weigh the platter and the ring disk on the scale and record the weights.
Measure the external torques on the rotation object and their corresponding tension force.
Place the platter on the rotation axis and turn the platter.
Hang a total weight of 35g over the pulley and wound the pulley string so that the weight is near the pulley.
Click Collect in the computer velocity detection program to measure the velocity time course.
After 30 seconds, the velocity detection program automatically stops.
Repeat from step 2 one time to get the average angular acceleration.
Take a screenshot of the velocity time course on the computer screen.
Repeat from step 1 nine more times, each with 10g heavier hanging weight, to obtain 35g, 45g, 55g, 65g, 75g, 85g, 95g, 105g, 115g, and 125g. However, only take screenshots of the computer screen at 65g and 125g hanging weight.
Measure the angular momentum of the rotation objects before and after a collision.
Place the platter on the rotation axis and turn the platter, and click Collect in the computer velocity detection program to measure the velocity time course.
Gently place the ring disk on top of the platter while carefully centering the ring disk on the exact same axis as the platter.
After 30 seconds, the velocity detection program automatically stops.
Take a screenshot of the velocity time course.
After the three experiment Sections are complete, enter the recorded data points inside Google Sheet.
Apparatus and Procedure
Complete list of equipment
Labeled block diagram of each part of the experiment
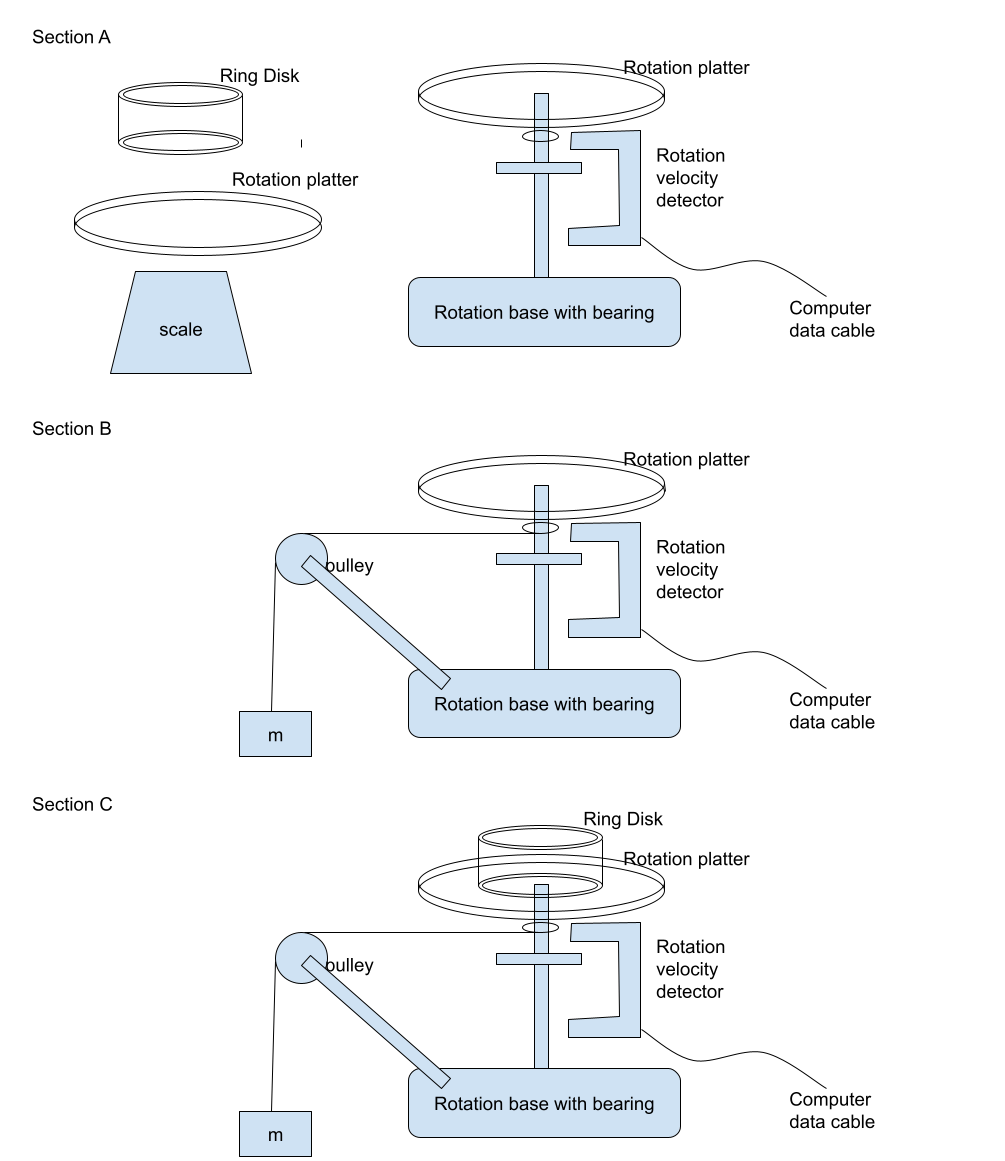
Describe the experiment
For Section A, the rotation of the platter slows down gently because the rotation base’s bearing gives it a relatively small friction. The Collect button of the computer velocity detector program should be clicked after the turning is smooth after an initial perturbation. When taking the measurement of angular velocity and angular acceleration, use the computer cursor to highlight a section of time where the velocity change is smooth.
The Google Sheet Table 1 for Section A uses this format,
For Section B, the weight is hooked to the rotation base by a string attached to a 5-gram hook. For each round of weight, add a 10-gram piece to increase the torque force. The string is wound to the rotation axis by turning the platter. When taking the measurement of angular velocity and angular acceleration, use the computer cursor to highlight a section of time where the velocity change is smooth.
The Google Sheet Table 2 for this section has this format,
For Section C, the initial perturbation of the platter is the same as Section A. When taking the measurement of angular velocity and angular acceleration, highlight the section where angular velocity suddenly decreases, indicating a collision course. The statistics to collect should be both before the after the collision.
The Google Sheet Table 3 for Section C has this format,
When taking the measurement of angular velocity and angular acceleration, the angular displacement data plots should be discarded.
After all data is recorded, perform all calculations on Google Sheet.
Results and Analysis
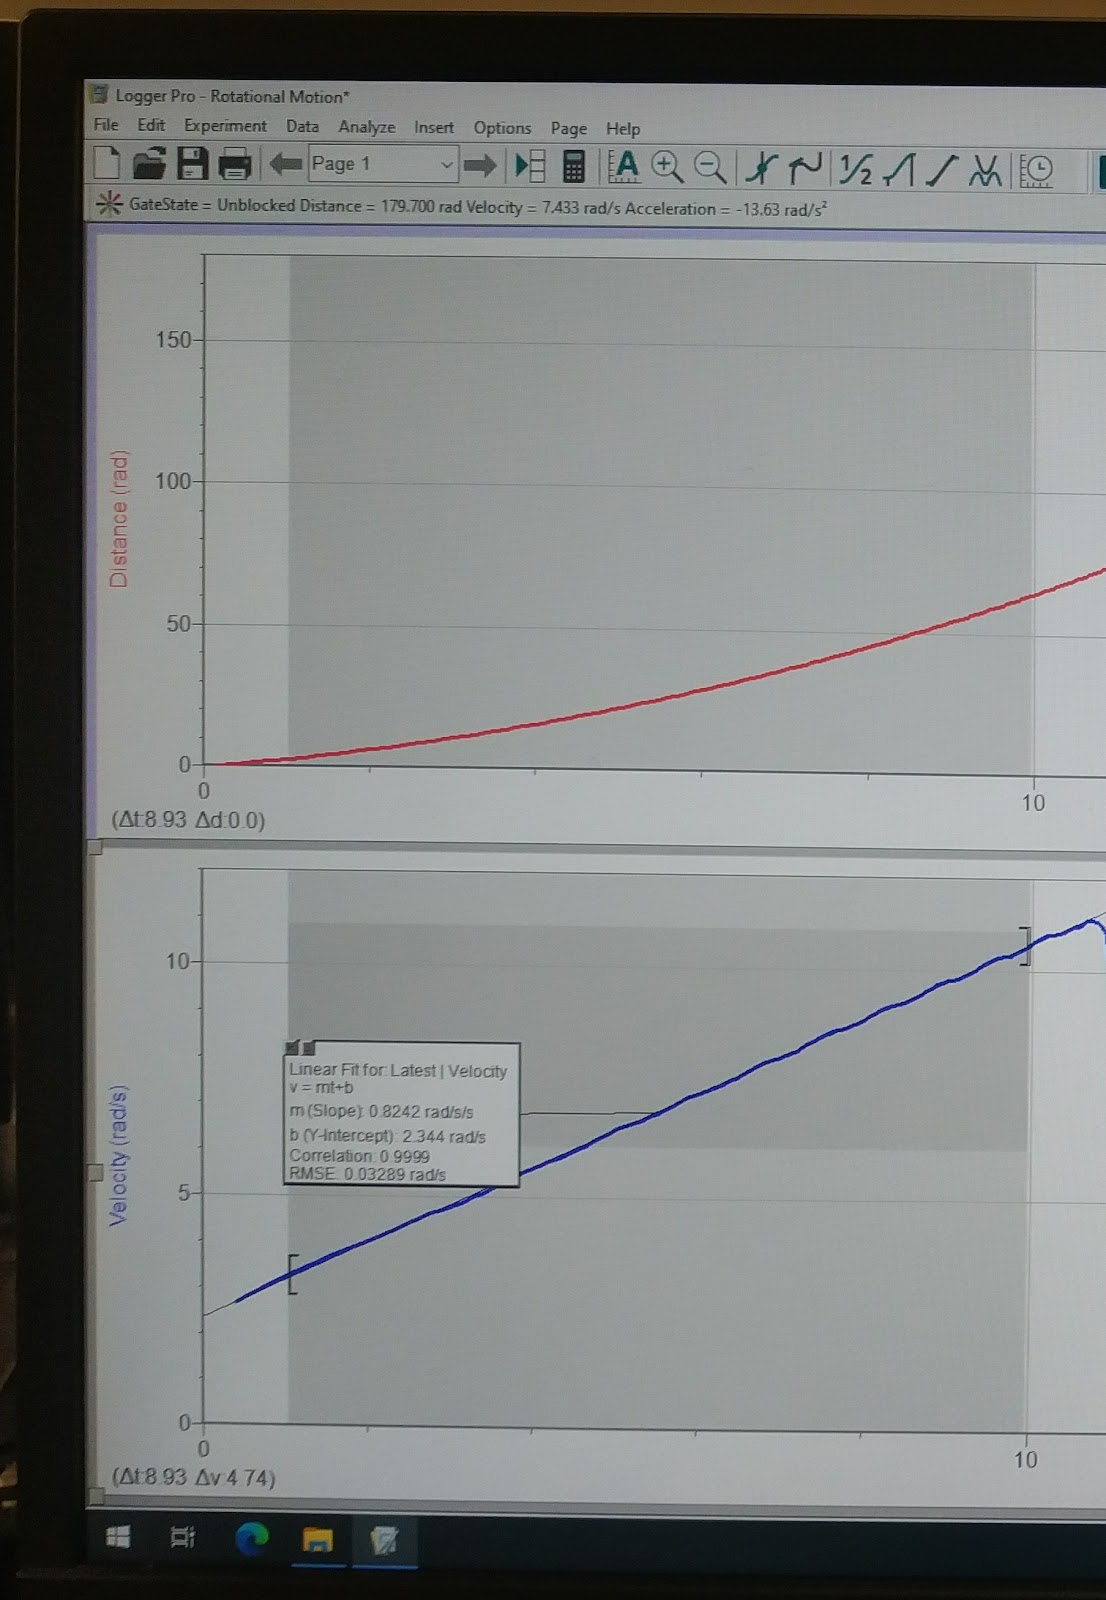
The first section of the experiment result is pictured in the following Picture 1 for the first data entry.
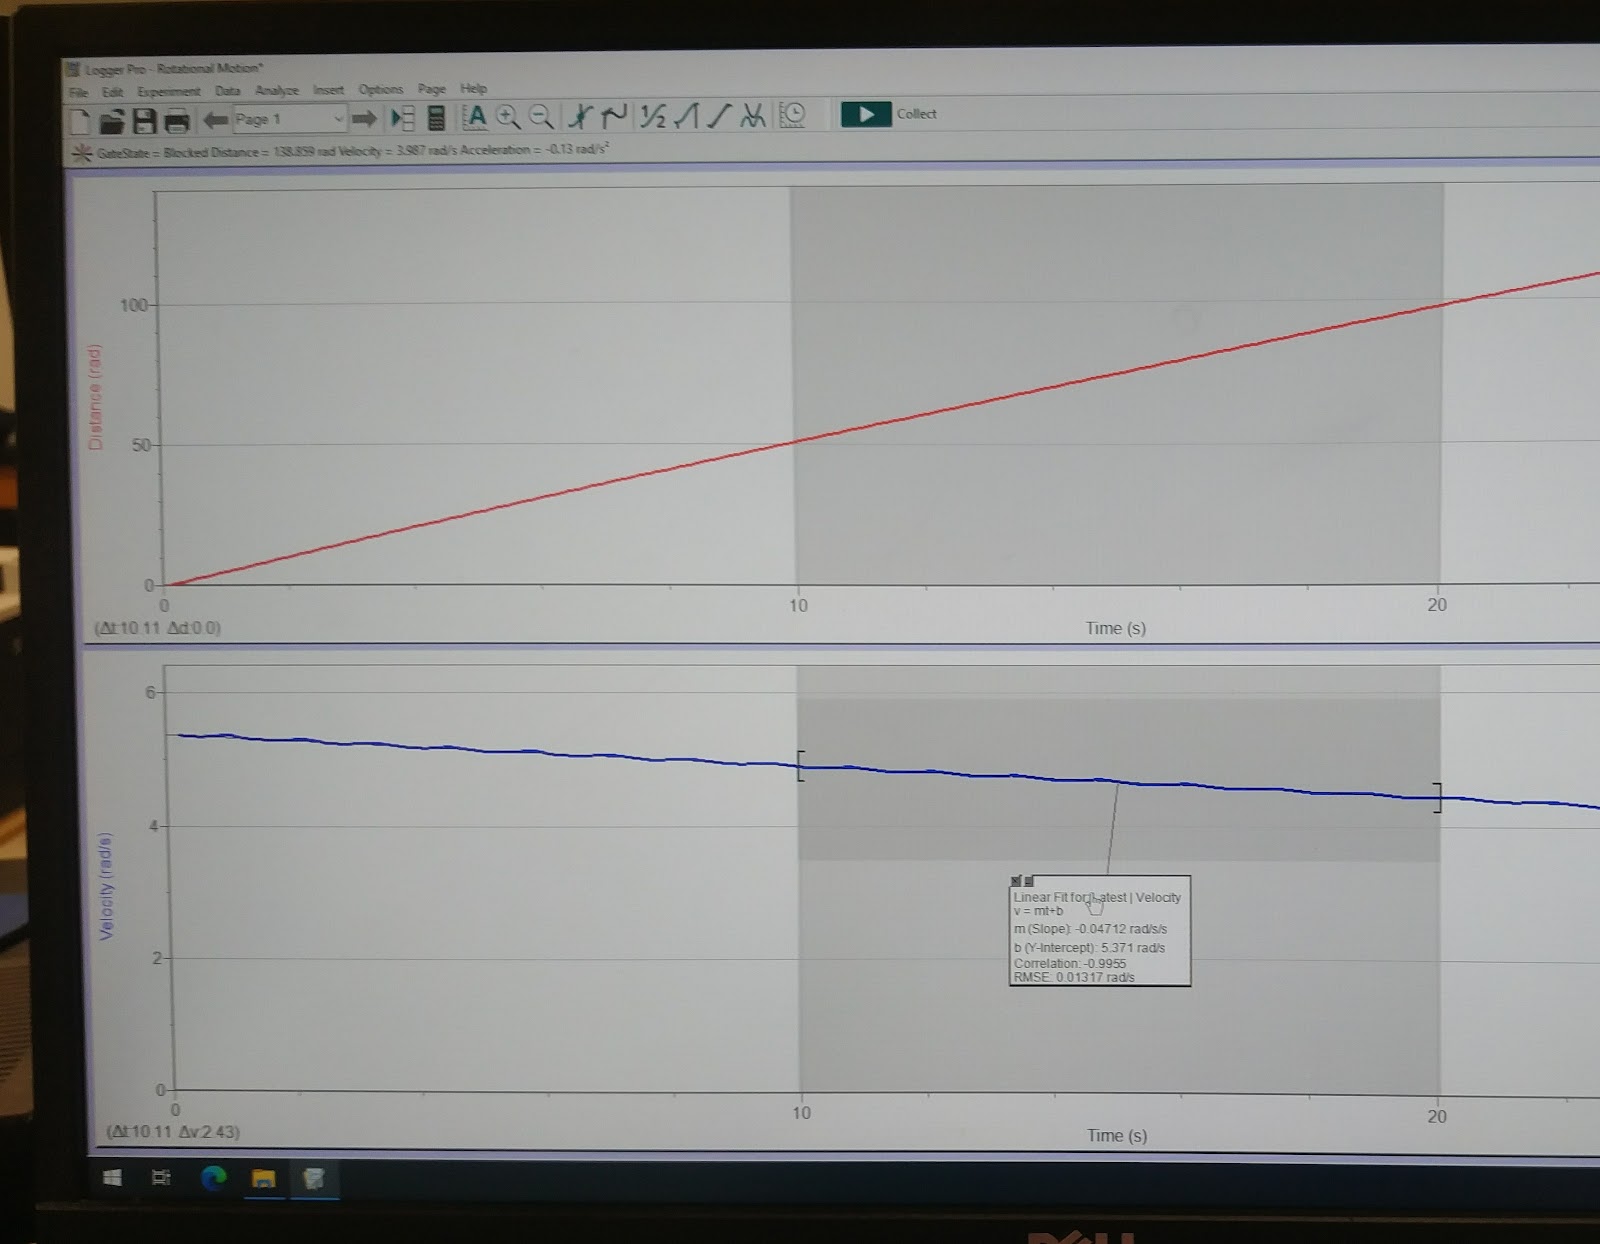
Picture 1.
The first section of this experiment’s result are shown in the following Table 1.
Table 1.
Sample calculation for the moment of inertia Ipl is 1/2 * 1.4171 * 0.1142^2 = 0.009241 kg.m^2 .
Sample calculation for the average friction alpha, (0.04712+0.04780+0.04908)/3=0.04800 (rad/s^2).
Sample calculation for the friction torque is 0.009241*0.04800=0.0004436 (N.m).
The second section of the experiment result is pictured in the following Picture 2, for 35g, 65g, and 125g sequentially.
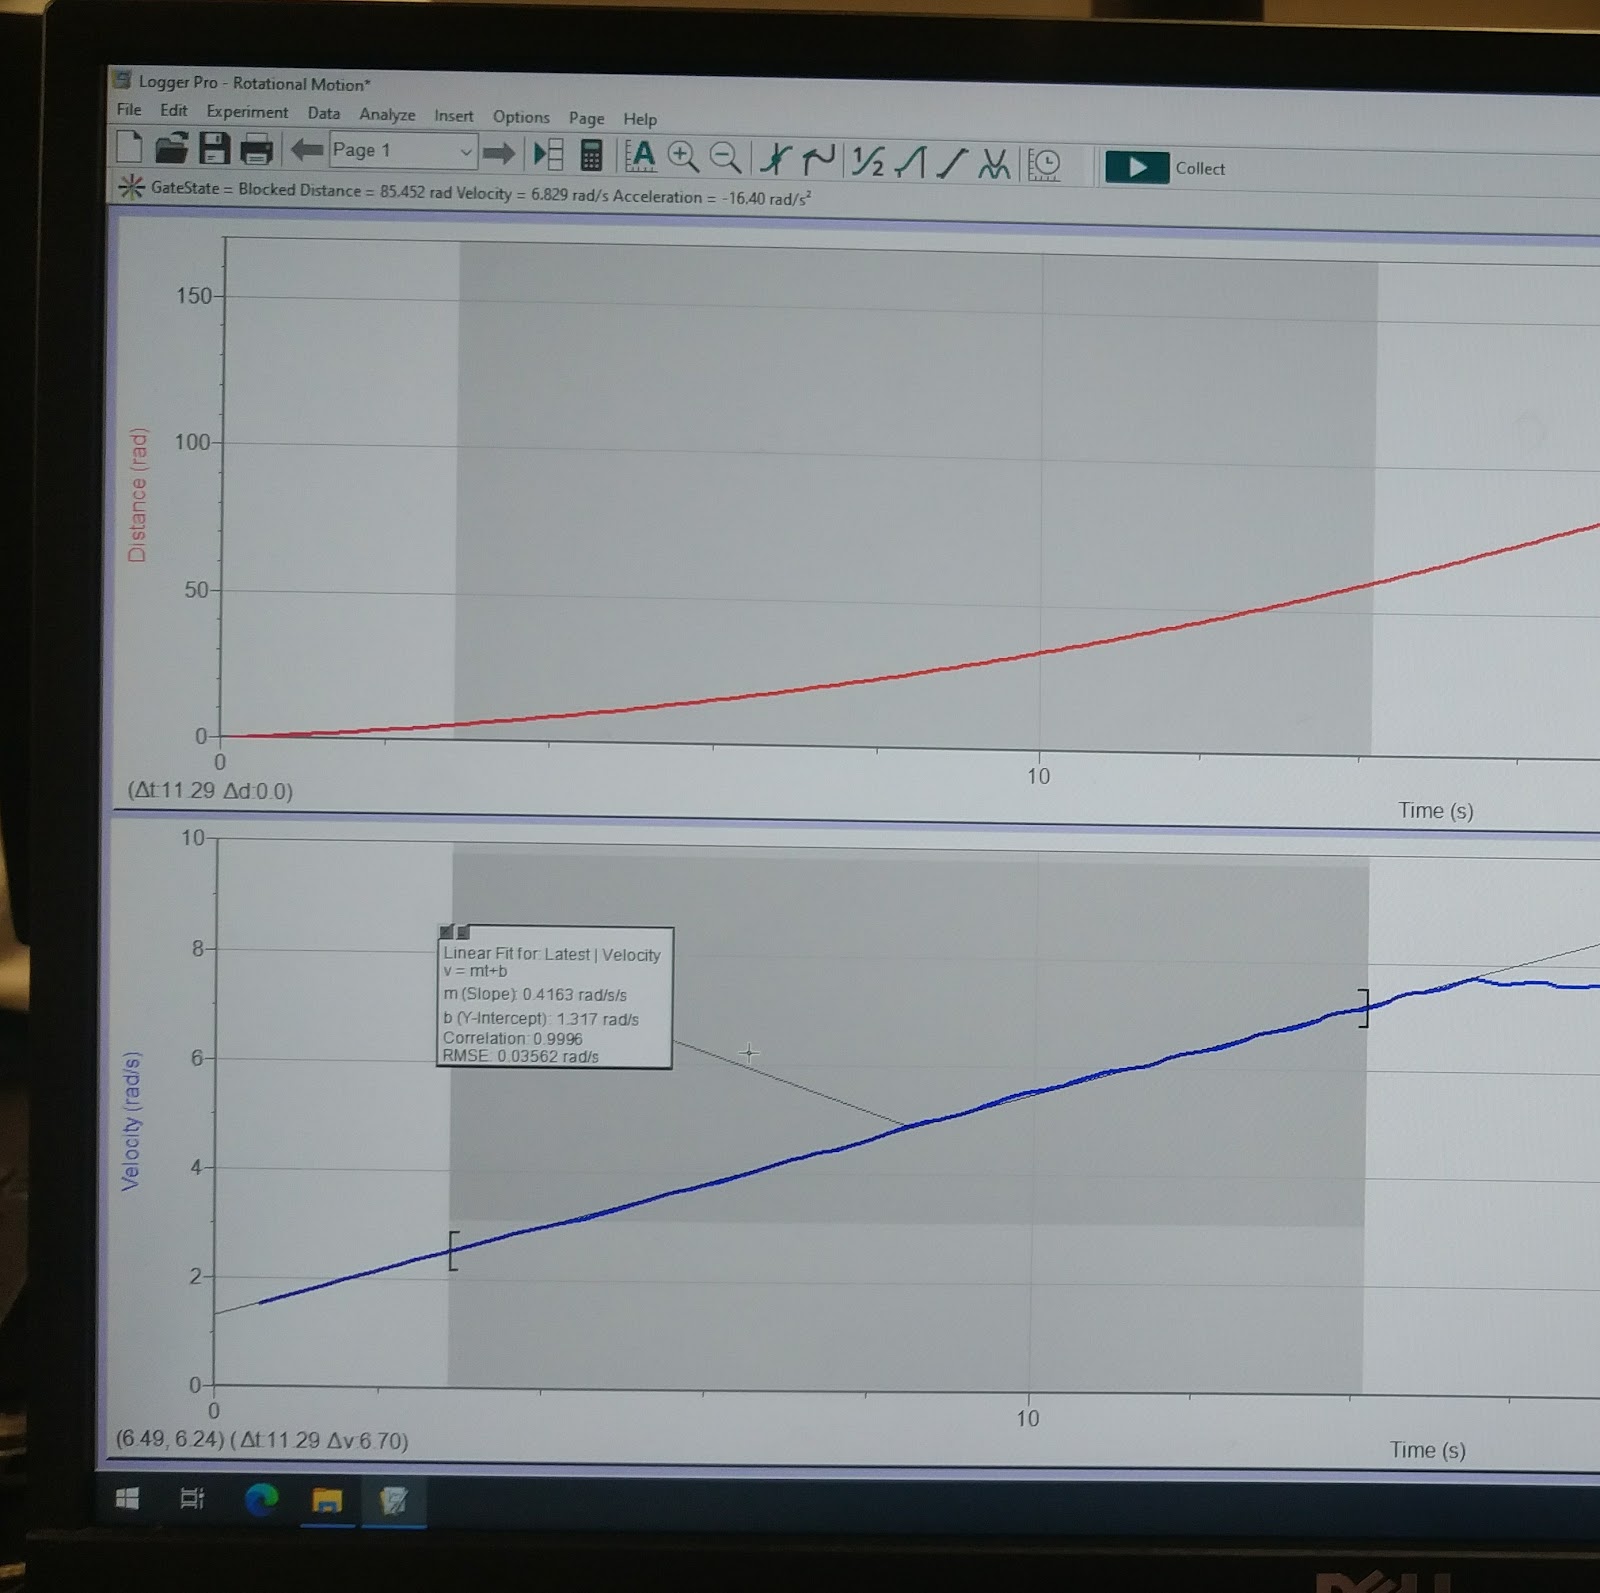
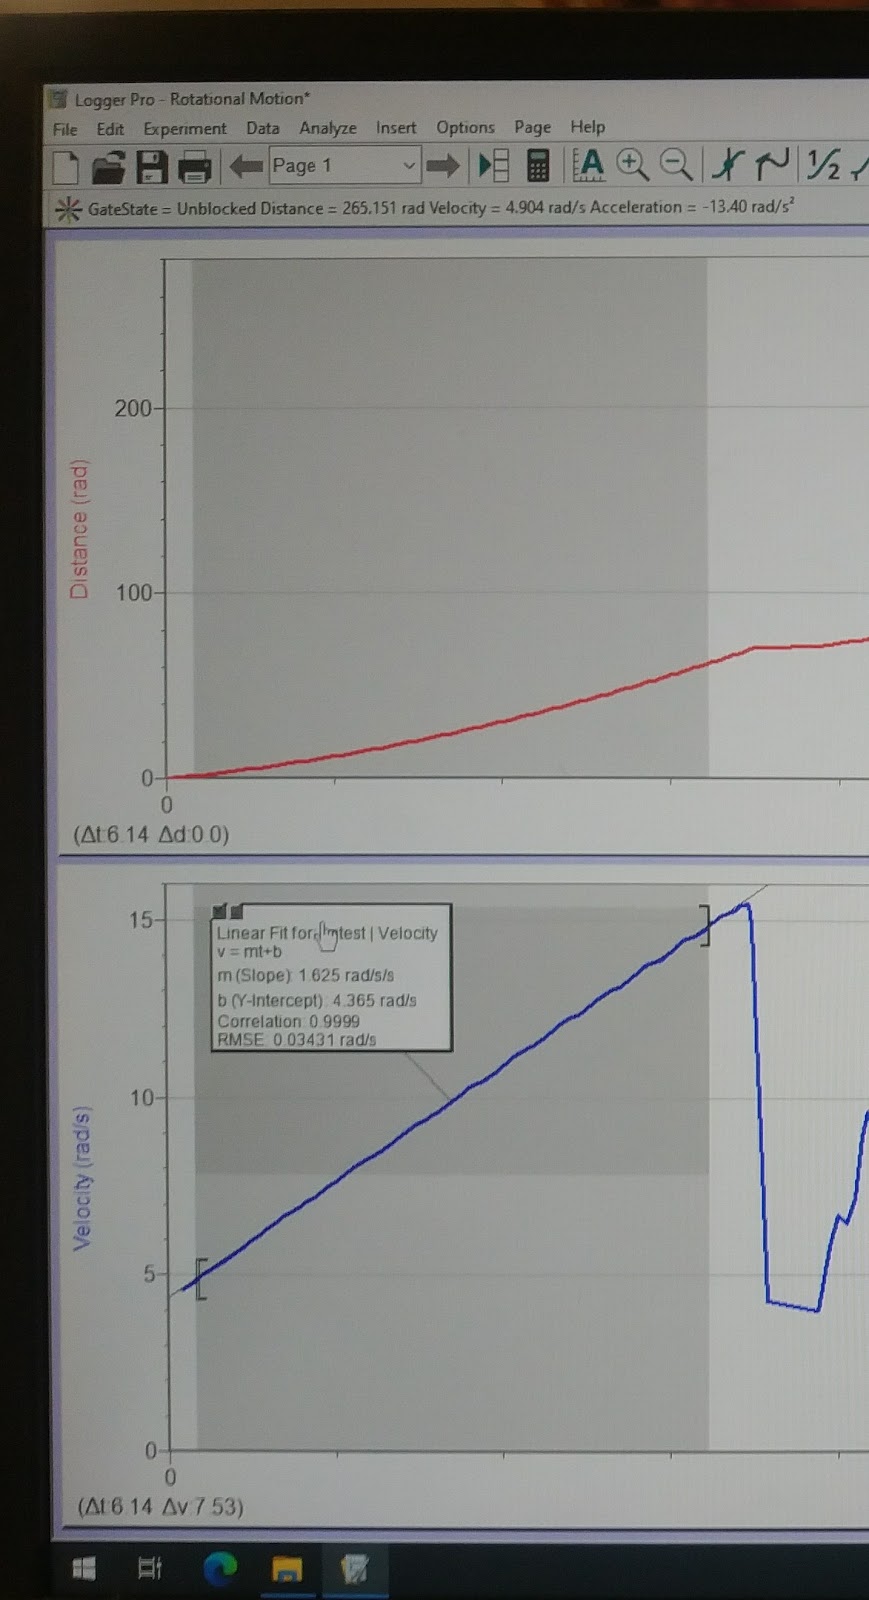
Picture 2.
The second section of this experiment’s result is shown in the following Table 2.
Table 2.
Sample calculation for the first row,
m=0.0350g,
alpha=0.4163 rad/s^2,
Cord Tension T=0.035*(9.8-0.4163*0.0126)=0.3428,
Applied Torque 0.3428*0.0126=0.004319.
The third section of the experiment’s result is in the following Picture 3.
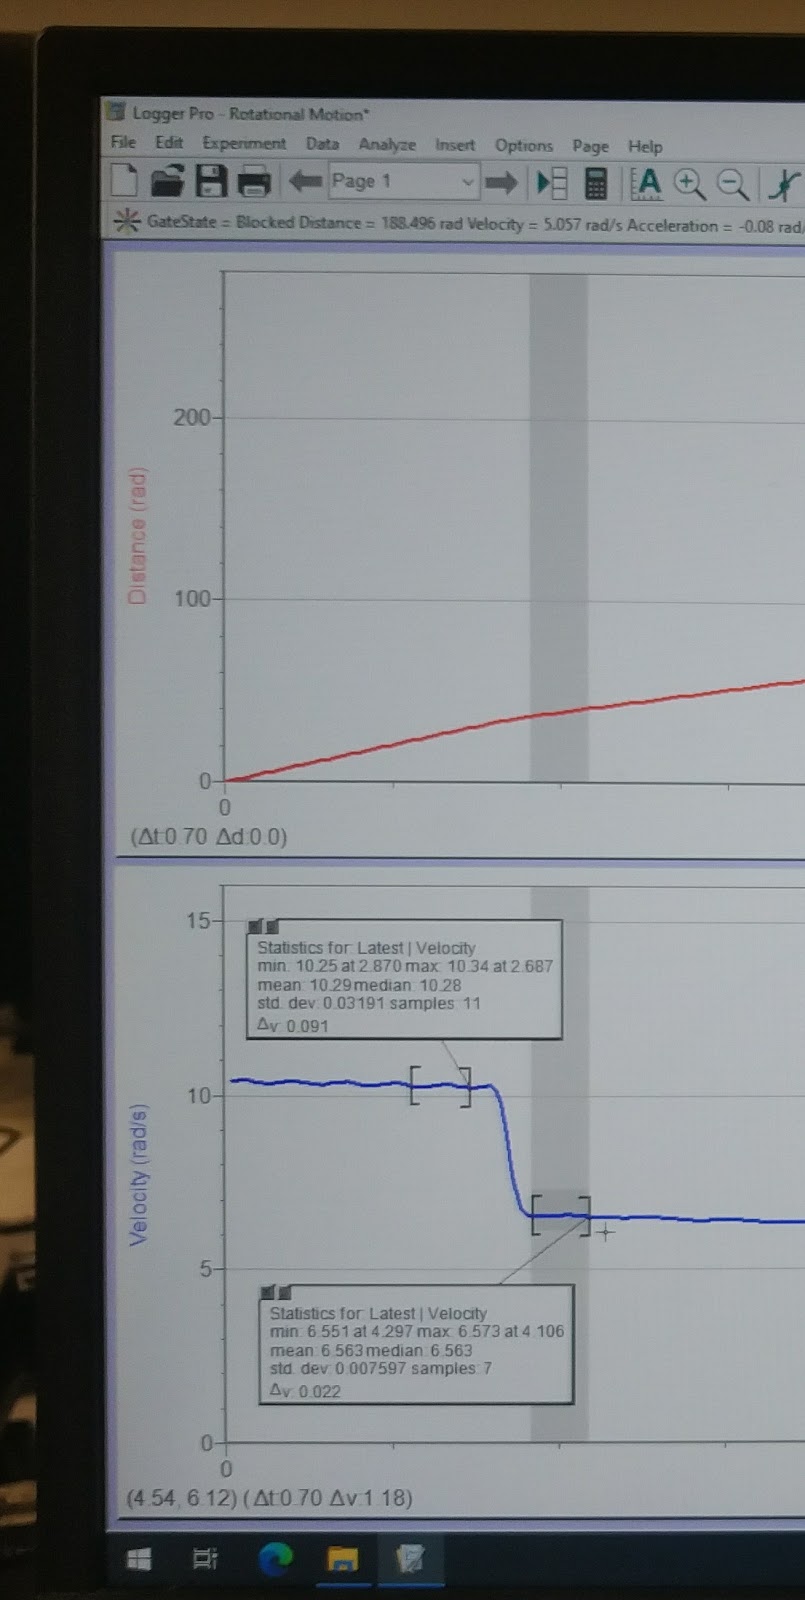
Picture 3.
The third section of this experiment’s result is shown in the following Table 3.
Table 3
Sample calculation for momentum of inertia Id 1/2 * 1.4342 * (0.0638^2 + 0.0537^2) = 0.004987 .
Sample calculation for angular momentum L before collision 10.29*0.009241=0.0951.
Sample calculation for angular momentum L after collision 6.563*(0.009241+0.004987)=0.0934.
Analysis
Section A Table 1’s Avg Friction angular acceleration is about 0.048 rad/s^2 ; theoretical moment of inertia the platter is 0.009241 kg.m^2 . Measured pure friction torque of 0.0004436 N.m .
Section B Table 2 produces the below Graph 2 plot.

The fitted linear equation is
Torque = 0.00956AngularAcceleration+0.000376
, and according to Equation 11
ext=Iα-f
, it means that the moment of inertia of the platter, I, is 0.00956 kg.m^2 .
Using Equation 6 and the measured angular acceleration of in Table1, 0.048 rad/s, friction torque is 0.009241*0.04800=0.0004436 (N.m). And the already determined Ipl is 0.009241 kg.m^2.
The I value of 0.00956 kg.m^2 is comparable to the Table1’s theoretical moment of inertia for a solid platter as 0.009241 kg.m^2 . The percent difference is (0.00956-0.009241)/0.009241*100%=3.45%.
Also, the fitted linear equation means that friction torque is 0.000376 N.m. And this value is also comparable to the Table1’s measured pure friction torque of 0.0004436 N.m. The percent difference is (0.0004436-0.000376)/0.0004436*100%=15.2% .
Section C’s complete inelastic collision angular before and after a collision should be exactly the same according to the law of conservation of angular momentum. Table 3’s angular momentum before collision is 0.0951 kg.m^2.rad/s ; angular momentum after collision is 0.0934 kg.m^2.rad/s . The percent difference is (0.0951-0.0934)/0.0951*100%=1.79% .
Discussion
Compared to theory
Section A Table 1’s theoretical moment of inertia for a solid platter as 0.009241 kg.m^2 are calculated, and no experimental data for comparison. The measured pure friction torque of 0.0004436 N.m can be compared with SectionB’s plot fitting line discussed below.
Section B Table 2’s theoretical moment of inertia, as inferred in Graph2 plot should be the same as Table1’s moment of inertia for a solid platter as 0.009241 kg.m^2 .
Using Equation 6 and the measured angular acceleration of in Table1, 0.048 rad/s, friction torque is 0.009241*0.04800=0.0004436 (N.m). And the already determined Ipl is 0.009241 kg.m^2.
The percent difference of 3.45% as calculated in Analysis section for Ipl can be attributed to the statistics error in linear fitting with multiple data points. The theoretical friction torque should be the same as Table1’s measured pure friction torque of 0.0004436 N.m . The percent difference of 15.2% as calculated in Analysis section for fcan be attributed to the non-uniform shape of the platter objection and non-constant dynamic friction coefficient with complex bearing mechanical parts.
Section C Table 3’s theoretical complete inelastic collision angular before and after a collision should be exactly the same according to the law of conservation of angular momentum. And the small percent difference of 1.79% means that the principle is well demonstrated in my experiment.
However, the theory requires that external forces and torques to be zero. The small percent difference of 1.79% likely is attributed to the non-zero friction torque.
Looking at Picture 1 and Picture 3, it is noticeable that the angular velocity is already on the decline over time even without any collision. And the collision course does take finite time, not instantaneous. So, during the collision course, friction is still decreasing the overall angular momentum, so the angular movement is not exactly the same before and after the collision. However, the small percent 1.79% momentum loss means that the experiment aparatus is a near-lossless system.
Uncertainty
The weighing scale has an uncertainty of 0.0001kg (0.1g). This is verified with the pulling weights from 35.0g to 125.0g.
The angular velocity and angular acceleration have a computer electronic uncertainty of 0.001 rad/s.
The caliper ruler for the spindle radius, platter, and ring disk has a precision of 0.1mm, so the uncertainty is 0.0001m.
We calculate the pattern moment of inertia by a formula for a uniform flat disk, but the actual platter has a hole at the center with metal bearings and a groove to center the ring disk that is dropped onto the platter, so, it is hard to determine the actual angular moment of inertia.
Difficulties
The largest percent difference of 15.2% of friction torque can be attributed to the non-uniform shape of the platter.
Also non-constant dynamic friction coefficient with complex bearing mechanical parts. When the platter rotates at different speeds, the bearing balls have combined motion of sliding and rolling depending on the rotation speed. Different combinations of sliding and rolling can have different dynamic friction coefficients. Indeed, Section A’s angular velocity is not exactly the same as Section B’s multiple different angular velocities.
Conclusion
My experimental measured data points in Table 1 through Table 3 show % differences at reasonably low ranges between theoretical calculated values and experimental data. The complete inelastic collision angular before and after a collision should be exactly the same according to the law of conservation of angular momentum and is well demonstrated in my experiment.
Restatement of the objection of this experiment is to measure a rotating object’s angular velocity change under external and friction torque according to angular motion dynamics. The complete inelastic collision angular before and after a collision should be exactly the same according to the law of conservation of angular momentum. The experiment is overall a success.
Questions
1. According to your measurements a small constant portion of the applied torque was
required to overcome friction and did not therefore contribute to the acceleration. How
much of the applied mass goes to overcome this frictional torque alone?
The friction torque is 0.0004436N.m as measured independently but with a calculated moment of inertia or 0.000376N.m as fitted by measured data points extrapolation. Radius of spindle is 0.0126m.
Torque = Force*Radius ; Force mg = Torque/Radius ;
mass m = Torque/Radius/g =
0.0004436 / 0.0126 / 9.8 = 0.00359kg , or 3.6 grams, or
0.000376 / 0.0126 / 9.8 = 0.00304kg , or 3.0 grams.
2. Using your largest measured angular velocity (with m = 125 g) but assuming no
hanging mass, how many rotations would the system make before finally coming to
rest.
The largest angular velocity is 15 rad/s as seen in Picture 2.
The friction alpha acceleration is -0.048 rad/s^2 as seen in Table 1.
Angular velocity =0+t
0=15-0.048t
t = 15 / 0.048 = 312.5 seconds
Angular displacement =0+0t+1/2t2
= 0 + 15 * 312.5 - 1/2 * 0.048 * 312.5^2 = 2343.75 rad
2343.75 rad * (1 RotationRevolution / 2 pi rad) = 373.0 RotationRevolutions
No comments:
Post a Comment