Cover page
Student name: John C Gibson
Course number: PHYS.1410L , Section 811
Instructor name: Benjamin MacConnell
Date of experiment: Oct 11, 2023
Partner’s name: (No partner)
Title of experiment:
Motion Down An Incline
Objective: Exercise rotating coordinate systems to obtain varying forces by gravitational acceleration. Measuring an object’s motions under the earth’s gravity acceleration in an incline to calculate the object's mass and compare the mass to the object's mass as measured by weighing instruments.
Introduction
Earth's gravity force affects all moving objects near Earth with acceleration g according to Newton’s second law of motion f=ma , where f is Earth’s gravitational force, m is the mass of an object, and a is acceleration. Earth exerts force on objects exactly proportional to mass, so a is a constant. And, a is denoted g when the earth’s gravitational force is concerned.
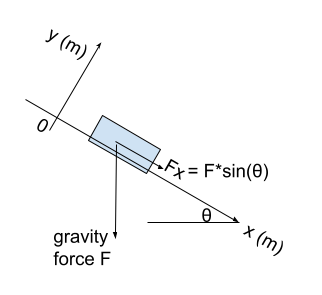
The accepted g value is 9.8 m/s2 . In our chosen coordinate system on the right, force Fg=m(kg)g (Nm/s2)=ma .
Fx=Fgsin()(mg) sin()=max Equation 1.
The normal force is perpendicular to the surface of the objection in concern, in the positive y-axis direction.
Fy= Fgy=(mg) cos()
However, the normal force is in the opposite direction of the gravitational force with equal magnitude. So, there is no net force on the y-axis. And there is no need to calculate acceleration on the y-axis.
Derivation:
To obtain the theoretical acceleration of the motion, divide both sides of the equation 1 by mass m; we obtain
ax=g sin() .
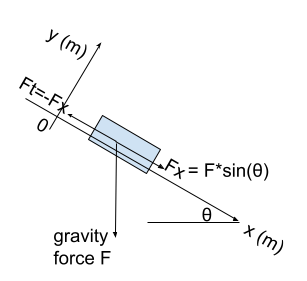
To obtain the theoretical force of the string tugging on the cart to keep it steady, the tension force is in the opposite direction of the gravitational force on the x-axis; the magnitude is the same as the gravitation force on the x-axis. According to equation 1,
FT= -Fx= -(mgsin()) .
To obtain the theoretical mass of the cart, divide both sides of the equation 1 by acceleration ax; we obtain
m=Fx/ax .
Steps
Calibrate the displacement detector by setting the cart object at the bottom of the incline and start the computerized measurement program.
Calibrate the force detector of the cart object by setting the cart-and-force-gauge assembly at the bottom of the incline and start the computerized measurement program.
Clamp the incline angle to 5 degrees and enter this angle to be recorded in computerized data entry for this run.
Use a looped string to pull the force detector’s hook with the cart to the top of the incline.
Measure the gravitational force by holding the string steady and engaging the force measurement computer program.
While holding the card at the top of the incline, start the displacement computer program, then release the cart.
Once the cart hits the bottom of the incline, stop the displacement measurement.
Repeat step 3 through step 7 five times, with increasing incline angle of 8, 11, 14, 17, and 20 degrees.
Weigh the cart and force detector together on a scale and keep a record of the mass.
In the computer software’s single run page, zoom and select velocity detection points to obtain each run’s acceleration by fitting the velocity data with a slope. Take a picture of the data.
In the computer software’s multiple run page, fit the acceleration-vs-force data with a straight line. Take a picture of the data.
In Exel/Google Sheet program, enter the multiple runs’ measured and theoretical acceleration and force.
In Exel/Google Sheet program, enter the scale-measured and theoretical cart mass.
Apparatus and Procedure
Complete list of equipment
Labeled block diagram of each part of the experiment
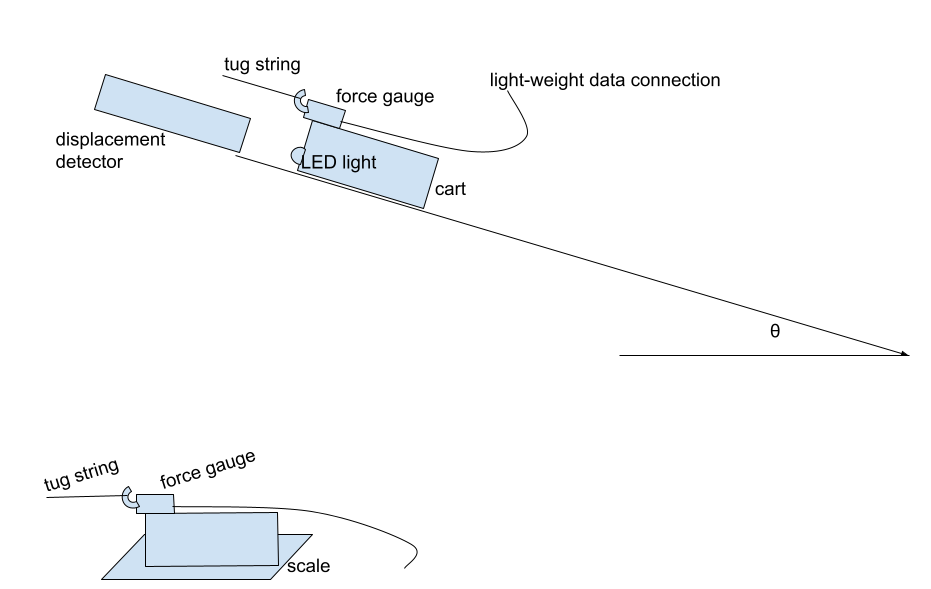
Describe the experiment
Calibrate the displacement detector by setting the cart object at the bottom of the incline and start the computerized measurement program.
Click the BEGIN button in the software and then click the Zero button to calibrate to save the calibration.
Calibrate the force detector of the cart object by setting the cart-and-force-gauge assembly at the bottom of the incline and start the computerized measurement program.
Click the Tare button on the force gauge and the BEGIN button in the software. Wait for 10 seconds. Make sure the force is smaller than 0.1N .
Clamp the incline angle to 5 degrees, and enter this angle to be recorded in computerized data entry for this run.
Use a looped string to pull the force detector’s hook with the cart to the top of the incline.
Measure the gravitational force by holding the string steady and engaging the force measurement computer program.
Click the Tare button on the force gauge first before making this measurement. Wait for 10 seconds. Make sure the force deviation is less than 0.1N.
While holding the card at the top of the incline, start the displacement computer program, then release the cart.
Use the BEGIN button of the displacement computer program, then START button just before releasing the tug string.
Once the cart hits the bottom of the incline, stop the displacement measurement.
Use the STOP button to stop the displacement measurement.
Repeat step 3 through step 7 five times, with increasing incline angle of 8, 11, 14, 17, and 20 degrees.
Weigh the cart and force detector together on a scale and keep a record of the mass.
In the computer software’s single run page, zoom and select velocity detection points to obtain each run’s acceleration by fitting the velocity data with a slope.
The slope is the acceleration. The data is in Picture 1.
In the computer software’s multiple run page, fit the acceleration-vs-force data with a straight line.
The slope is the mass of the cart. The data is in Picture 2.
In Exel/Google Sheet program, enter the multiple runs’ measured and theoretical acceleration and force.
The data is in Table 1.
In Exel/Google Sheet program, enter the scale-measured and theoretical cart mass.
The data is in Table 2.
Results and Analysis
The measured per-run velocity data with fitted acceleration slope are shown in the following Picture 1.
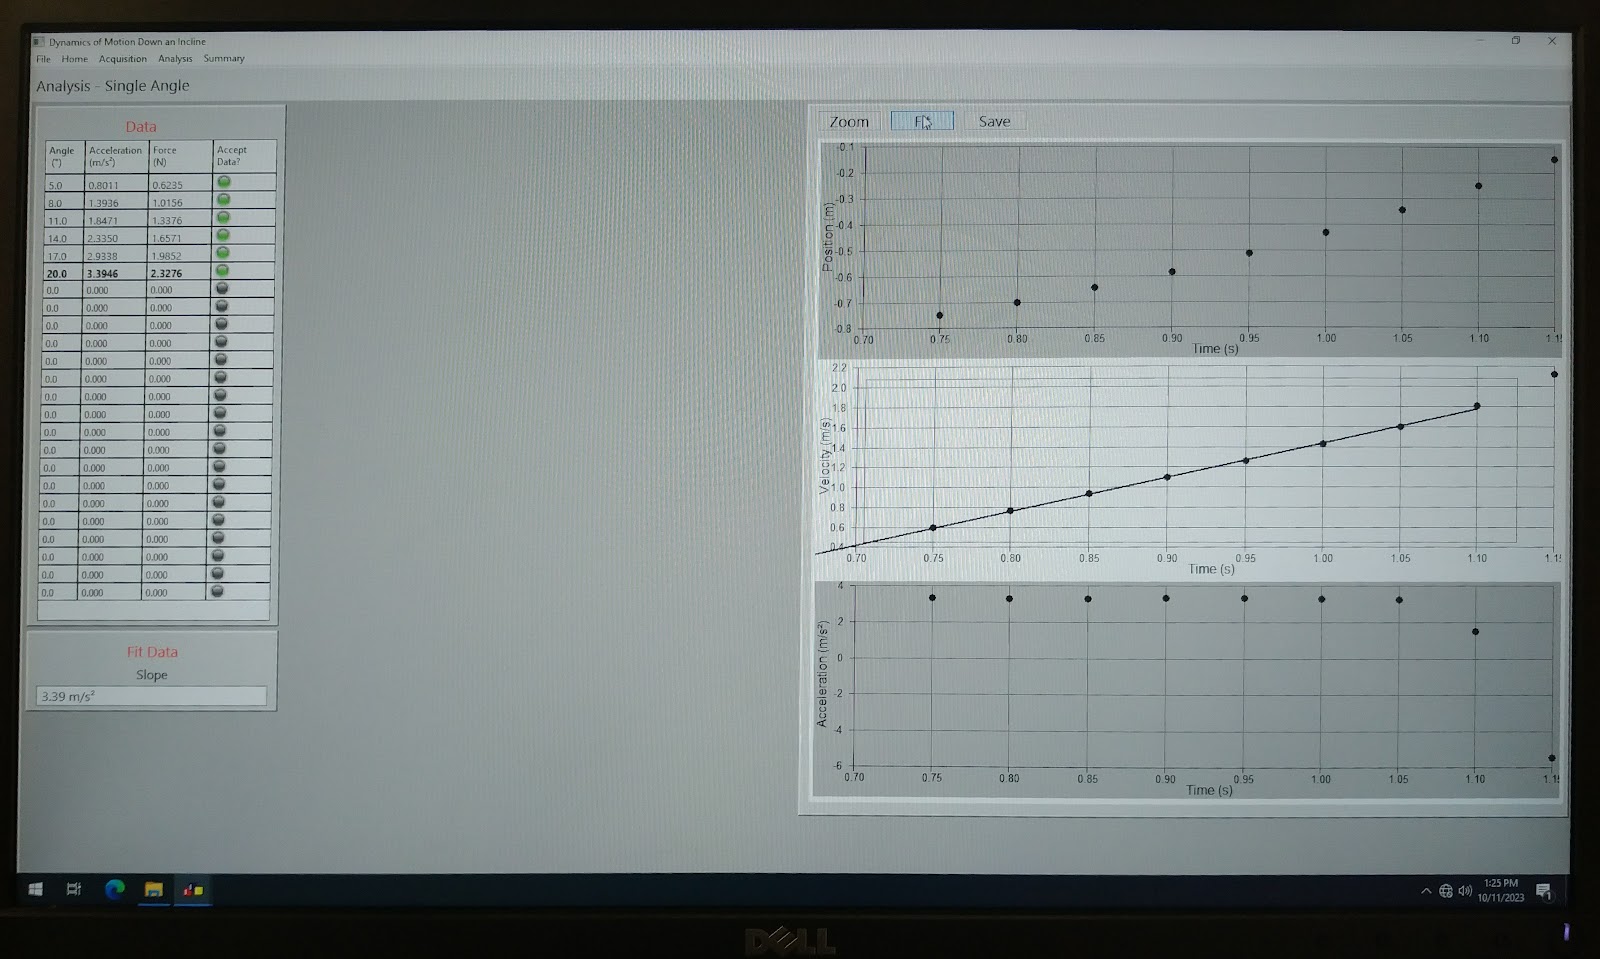
Picture 1.
The measured multiple-run acceleration-vs-force and fitted slope of mass are shown in the following Picture 2.
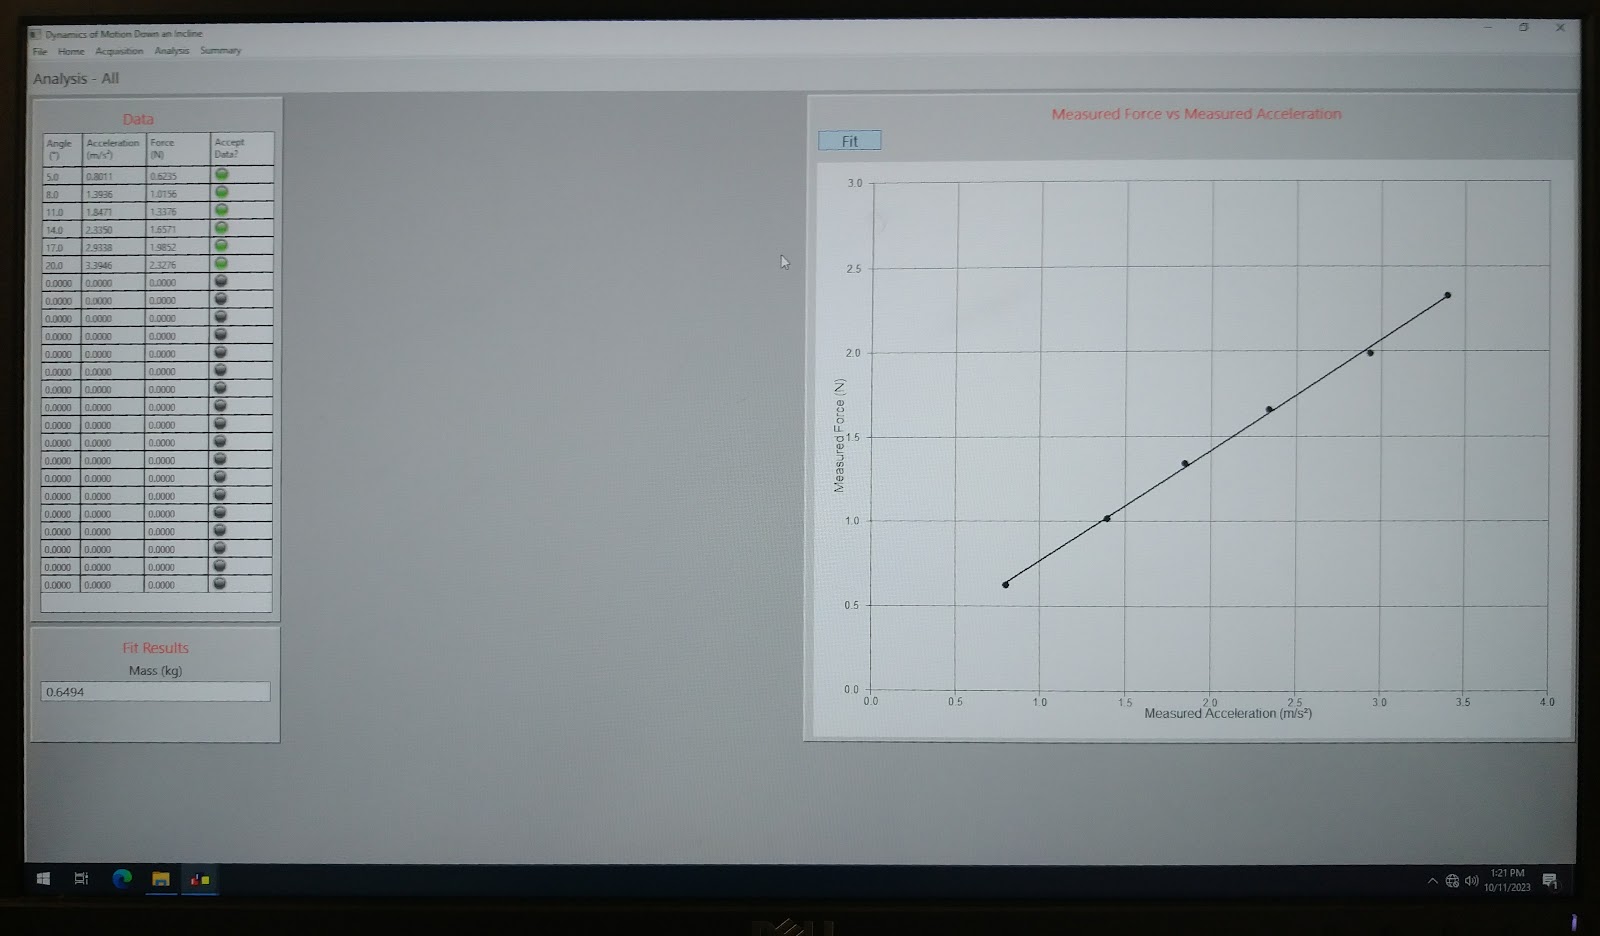
Picture 2.
The multiple runs’ measured and theoretical acceleration and forcer are shown in the following Table 1.
Table 1.
Sample calculation for the first 5-degree run:
a theoretical = 9.8*sin(5/180*3.14159) = 0.854 (m/s^2)
F theoretical = 0.676*9.8*sin(5/180*3.14159) = 0.577 (N)
The scale-measred and acceleration-measured-calculated mass of the cart-force-gauge assemble are shown in the following Table 2.
Table 2.
Sample calculation: (0.649 - 0.676)/0.676 * 100% = -3.99% .
Analysis
Acceleration in slope: As shown in the above Table 1’s “a measured” column and “a theoretical” column, the measured acceleration increases with the slope increment. The trend lines of acceleration vs. incline angle are in the following Graph 1. The measured acceleration fluctuates above and below the theoretical value.

Graph 1.
Force of gravity in slope: As shown in the above Table 1’s “F measured” column and “F theoretical” column, the measured force increases with the slope increment. The trend lines of force vs. incline angle are in the following Graph 2. The measured force is slightly higher than theoretical calculated value.

Graph 2
Mass of object: As shown in the above Table 2, the scale-measured mass is 0.676kg.
All measured data points are close to theoretical calculation.
Discussion
Compared to theory
As shown in Graph 1 of Acceleration vs. Angle. My measured accelerations fluctuate above and below the theoretical value. But overall the measured data is very close to theoretical value points.
As shown in Graph 2 of Force vs. Angle. My measured forces are above the theoretical value. This can be attributed to the mass of the data connection cable between the force gauge and the computer data port. The extra mass can pull down the cart in addition to gravity force.
As shown in above Table 2, the scale-measured mass is slightly higher than the calculated theoretical mass based on acceleration. This can be attributed to the data-connection cable’s mass, which adds acceleration, hence the calculated lighter mass.
Uncertainty
The weighing scale has an uncertainty of 0.001kg.
The force gauge has an uncertainty of 0.001N.
The displacement has an uncertainty of 0.001m.
The incline angle has an uncertainty of 0.1 degrees.
Difficulties
The air resistance and the data connection cable’s resistance are hard to ascertain. Also, the data-connection cable’s contribution to acceleration is hard to measure.
Conclusion
My experimental measured data points in Graph 1 and Graph 4 are close to calculated theoretical values.
Also, my calculated cart mass of 0.649kg is very close to the scale-measured cart mass of 0.676kg. My experiment was a success.
Restatement of the objection of this experiment is to obtain varying forces by gravitational acceleration and use the relationship F=m*a to determine the object’s mass m.
Measuring an object’s motions under the earth’s gravity acceleration in an incline leads to calculating the object's mass, this calculated mass is comparable to the mass the object weighs as measured by weighing instruments.
The objection is to check whether the calculated mass is close to the scale instrument measurement. And indeed the 2 mass values are close. The objection is achieved. My experiment was a success.
Questions
What factors affect the acceleration of an object rolling down an incline?
Gravity of the earth F=ma, the higher gravity the higher acceleration.
Incline angle, the larger the higher earth’s gravity has the component parallel to the incline.
Air resistance, which lowers acceleration.
Friction between cart and incline, which lowers acceleration.
Data connection cable friction, which lowers acceleration.
Did the experimental results match the theoretical predictions for the acceleration? If not, what factors might have contributed to any discrepancies?
Yes, the measured and the calculated theoretical values are very close in my experiment. The discrepancy is no more than 6.2%. The friction and air resistance likely contribute to the discrepancy at a 5-degree angle because gravity force is smallest at a 5-degree angle, so the other forces are comparatively larger.
How would the results have differed if the incline was rougher?
The measured acceleration would be smaller because the friction force is opposite of gravity acceleration force direction.
The measured acceleration-derived mass will be larger. Because when acceleration is smaller, F=ma equation indicates that mass and acceleration are inversely proportional when F is a fixed value determined by the force gauge.
No comments:
Post a Comment