Cover page
Student name: John C Gibson
Course number: PHYS.1410L , Section 811
Instructor name: Benjamin MacConnell
Date of experiment: Sep 13, 2023
Partner’s name: (no partner)
Title of experiment:
Motion In Free-Fall
Objective: Measuring gravity acceleration. Using a paper strip with a hammering timer, the free fall of a weight is recorded with its traveling motion. The hammering strikes ink onto the paper strip, which is measured for the spacing of the ink marks. Velocity and acceleration due to gravity are calculated by fitting the measured data points to equation curves.
Introduction
The distance of travel equation for free fall due to gravity acceleration is
y = y0+ v0 t + 1/2a t2
, where y0 is the starting point displacement from the origin,
v0 is the initial velocity of the object,
t is time, which is 1/40 = 0.025 seconds in this experiment,
a = g , which is acceleration by gravity, which is what we want to measure in this experiment if we choose our coordinate system to point y downward toward the center of the earth, as illustrated in the figure on the right.
The falling object’s initial displacement is 0 in this chosen coordinate. This coordinate system is chosen for convenience because the acceleration due to gravity is positive, the same sign as “a,” and the displacement is always positive.
Derivation:

The falling object is pulled by the earth’s gravity toward the center of the earth. When the falling distance is much smaller than the earth's radius, the pulling force is constant, and the acceleration is constant. We express this constant as “a” in this equation.
v = v0 + a t
The free falling distance from the starting position y0 should be expressed as so,
vav= (y - y0) / t
Furthermore, the vav for a constantly accelerating body is the geometric average of the instantaneous velocity across the time interval, shown in the above velocity-versus-time plot, expressed as so,
vav= (v0 + v) / 2
Combine the last 2 equations, (y - y0) / t = (v0 + v) / 2
Multiply both sides with t, (y - y0) = t(v0 + v) / 2
Substitute v with first equation’s v0+at, y - y0 = t(v0+v0+a t) / 2 =t(2v0 + a t)/2=tv0+12a t2
Keep only the displacement y on the left side and move y0 to the right side,
y = y0+tv0+12a t2
We will collect y values during the free fall, and use a parabolic curve to fit the data points to obtain 12a .
Then acceleration due to gravity will be g = a, with downward as the chosen coordinate’s positive y direction.
Steps
Measure out a 60cm long paper strip and cut it to 60cm length
Tie the paper strip to the loop of the 200g weight
Clamp the hammer timer to the workbench with the clamp
Thread the paper strip to the hammer timer between the hammer and ink patch
Hold the paper strip’s far end straight up and let the 200g weight suspend close to the hammer timer
Turn on the hammer timer to the 40Hz setting
Let go of the paper strip and the 200g weight
Hammer action leaves 1 ink mark on the paper strip for each time point.
Use the caliper to measure the spacing between 2 adjacent marks
Enter the measured spacing y’s into an excel or google sheet.
Use a linear curve to fit the instantaneous velocity versus time data points.
Use a parabola curve to fit the displacement versus time data points.
Apparatus and Procedure
Complete list of equipment
Labeled block diagram of each part of the experiment
Describe the experiment
Measure out a 60cm long paper strip and cut to 60cm length
Use the 1 metre ruler to measure the length and pinch it off with fingers.
Tie the paper strip to the loop of the 200g weight
Clamp the hammer timer to the workbench with the clamp
Thread the paper strip to the hammer timer between the hammer and the ink patch
The paper should be in between the stainless steel hammer and the ink patch
Hold the paper strip’s far end straight up and let the 200g weight suspend close to the hammer timer
Keep the paper strip as verticle as possible so that the paper doesn’t rub on the hammer timer during freefall.
Turn on the hammer timer to the 40Hz setting
This timing setting means that t is 1/40=0.025 sec between 2 adjacent observed displacement points.
Let go of the paper strip and the 200g weight
Watch out for the falling weight.
Hammer action leaves ink marks on the paper strip.
Use the caliper to measure the spacing between 2 adjacent marks
Discard the initialing hammering marks that clump together.
Enter the measured spacing y’s into result table and into Excel or Google sheet.
Calculate the midpoint time for each time entry tnby averaging it with the previous time entry, (tn-1+tn)/2
Calculate the average velocity for each midpoint time entry, Vav=y / 0.025s
Use a linear curve to fit the instantaneous velocity versus time data points.
Calculate t for each entry, starting with 0 sec, and accumulate 0.025 sec for each entry further in time.
The spacing y’s are also accumulated to give the actual displacement y for any time point t.
Use a parabola curve to fit the displacement versus time data points.
Results and Analysis
The recorded result y’s is shown in the following table.
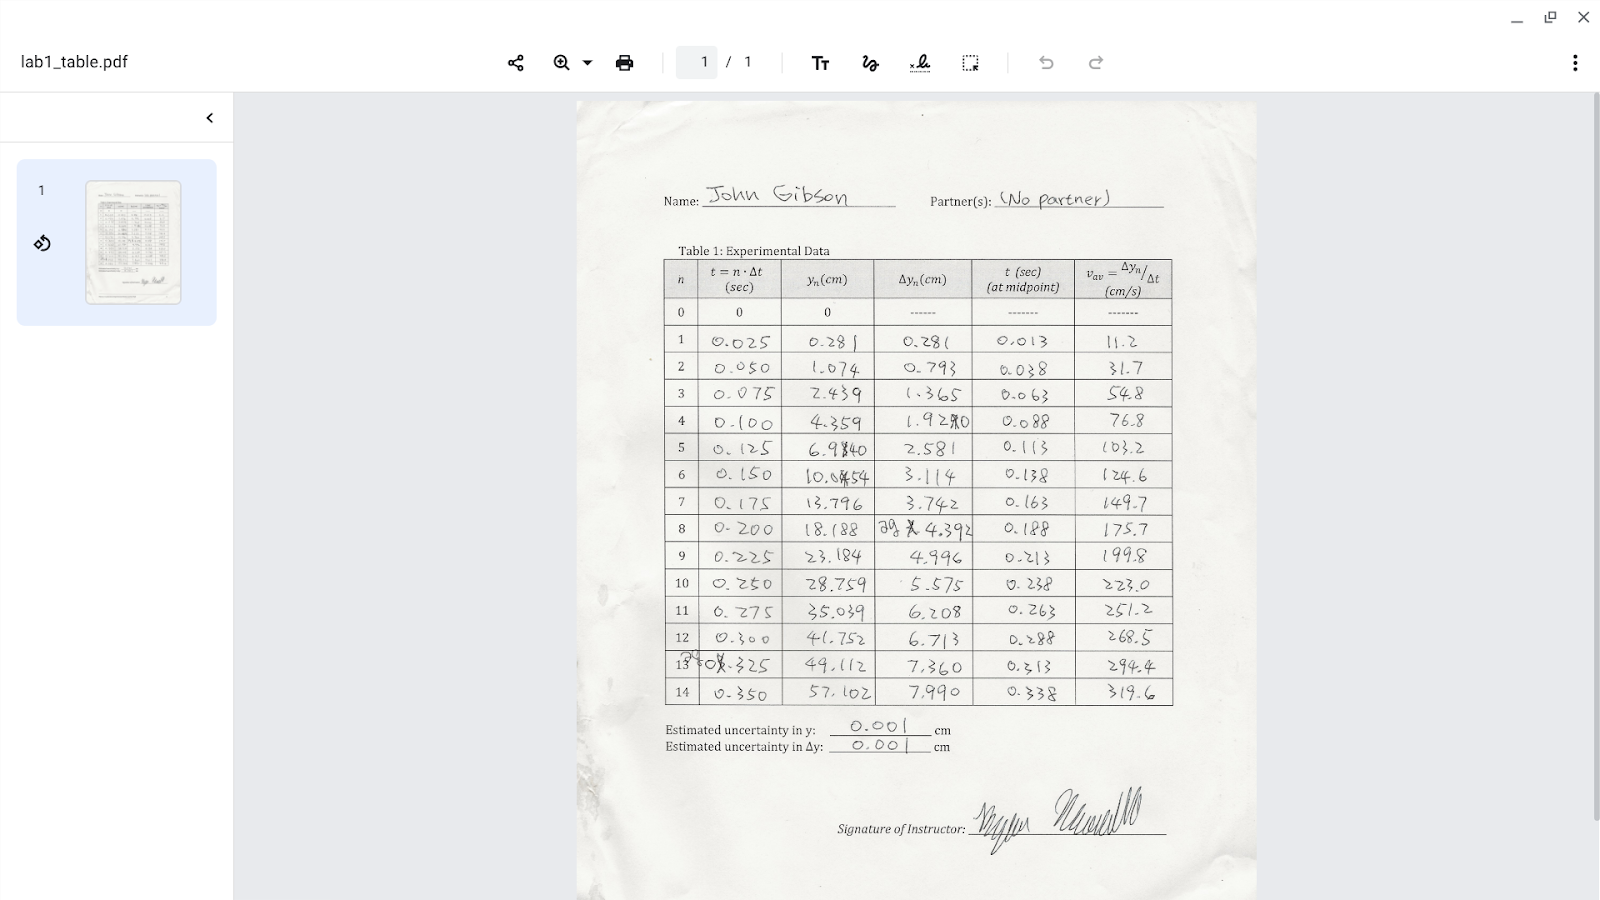
Table 1.
Sample calculation for n=1,
Yn = 0 + 0.281 = 0.281cm , t midpoint = (0 + 0.025)/2 = 0.013s,
Vav = 0.281 / 0.025 = 11.2 cm/s .
Sample calculation for n=14,
Yn = 49.112 + 7.990 = 57.102cm, t midpoint = (0.325 + 0.350)/2=0.338s,
Vav = 7.990 / 0.025 = 319.6 cm/s .
The calculated t midpoint and Vav are plotted in the following graph.

Graph 1.
The t and the calculated Yn are plotted in the following graph.

Graph 2.
Analysis
As shown in the above “Instantaneous Velocity vs Time” Graph 1, the fitting trend line has a slope of 958cm/s2. This slope is the acceleration due to gravity.
As shown in the above “Displacement vs. Time” Graph 2, the fitting parabola has a quadratic term coefficient of 481, which is 1/2a , half of acceleration by gravity. 1/2 958cm/s2 =479 481 .
This means that the measured acceleration is close to 958cm/s2 and consistent with a quadratic relationship between time and displacement when acceleration is a constant.
Discussion
Compared to theory
My measured acceleration by gravity is 958cm/s2= 9.58m/s2 , which has a 9.8 -9.58 = 0.22m/s2 difference from the generally accepted value of earth gravity acceleration. This difference is about 2.2%.
My experiment result’s error is likely due to friction between the paper strip and hammer timer, and also air resistance.
Uncertainty
The caliper’s precision is 0.1mm, and my measurement’s last digit, such as 6.713cm, is estimated. So the uncertainty is on the last digit 0.001cm.
Difficulties
The friction and air resistance are the difficulties of the experiment. The experiment error is mostly attributed to friction and air resistance, not caliper precision uncertainties.
Conclusion
My experiment measured acceleration by gravity at 9.58m/s2 . It is not too far away from accepted value.
Restatement of the objection of this experiment is to use a simple hammer timer to record gravity acceleration on a paper strip, and acceleration can be deduced by fitting the measured data points to equation curves.
The objection is achieved. My experiment was a success.
Questions
1. What is the difference between your value of g and the accepted value? What do you
consider to be the principal sources of experimental uncertainty in your
measurement?
The difference is 9.8 -9.58 = 0.22m/s2 .
I consider the principal source of uncertainty to be friction between the paper strip and hammer timer and air resistance on the paper strip because the paper strip flaps around in the air.
2. If the weight had been given an initial downward push instead of being released from
rest, what effect (if any) would this have on your measured value of g?
No effect on the measured value of g. Because we measure the g by the difference between successive Vav, not the Vav value itself. When all the Vav are increased equally with the initial push, the difference between successive Vav will still be the same g.
3. Prove that when the acceleration is constant, the average velocity over a time interval
is equal to the instantaneous velocity at the midpoint of the time interval.
When acceleration is a constant, the slope of the velocity plot is the same at every time point between the time interval (T1,T2). So, the velocity is a straight line, as pictured here.
The mid-point time Tm = (T2+T1)/2 . Midpoint instantaneous velocity Vm=v0+aTm .
xn = 0Tn(v0+at)dt =x0+ v0 Tn +1/2a Tn2
The definition of average velocity is vav= (x2 - x1)/(T2 - T1) .
For the numerator of the definition of average velocity, by algebra factoring,
(x2-x1) = (x0+ v0 T2 +1/2a T22)-(x0+ v0 T1 +1/2a T12)=
v0(T2-T1)+1/2a (T22-T12)=v0(T2-T1)+1/2a (T2+T1)(T2-T1)
We see that (T2-T1) is a common factor of the 2 terms.
For the whole vav =(x2-x1)/(T2-T1)=
v0(T2-T1)/(T2-T1)+1/2a (T2+T1)(T2-T1)/(T2-T1)=v0+1/2a (T2+T1)=
v0+a(T2+T1)/2=v0+aTm =Vm
So, Vav=Vm .
In words, Vav=Vm means that the average velocity equals the instantaneous velocity at mid-point time.
4. Should the tangent to your displacement-time curve at the point selected to be y= 0
and t = 0 be horizontal? Explain your answer carefully.
That tangent line should be close to horizontal, but the slope of that tangent line may not be exactly zero.
My displacement-timer curve is 0.0899 - 5.57x + 481t2
, and the tangent slope for every point of my curve is dxdt= -5.57 +481t
, and with t=0, the tangent line slope is -5.57+ 4810 = -5.57cm/s, which is the initial velocity of the free-fall object. It is not exactly zero because my hand is not completely still when releasing the 200g weight.
No comments:
Post a Comment