University Of Massachusetts, Lowell
Biochemistry Techniques, Group 10
Students: John Gibson (no partners)
April 21, 2024
A Micro-Scale Production Of Taq DNA Polymerase Protein
Abstract
Taq DNA polymerase was indispensable in the PCR technique and other biological science and engineering applications due to its high heat tolerance. PCR technique amplifies a fragment of DNA by repeating heat separation of double-stranded DNA and annealing DNA primer and extension of semiconservative daughter DNA molecules. The amplified DNA is invaluable in forensic justice, habitat research, biochemical research, and beyond. However, naturally occurring Taq DNA polymerase could not be easily reproduced in appreciatable quantity in a laboratory setup. The goal of this study was to establish a practice of production of lab-scale Taq protein, and this study experiment used a commercially available strain of E. coli bacteria with pAKTaq as a starting material and cultured it in a laboratory setup to induce the synthesis of Taq protein. The produced Taq protein was extracted from E. coli cell culture and purified, yielding a 1 mL suspension at about 0.15 mg/mL concentration. The produced Taq protein was verified to be correct in identity and enzymatically active. This experiment successfully demonstrated the ease of use of commercially sourced material supplies in such a micro-scale production of Taq DNA polymerase. Specifically, the methods and techniques used in this experiment were 1) culturing and inducing Taq overexpression in engineered E. Coli bacteria with IPTG at optimal growth phase, 2) thermal separation of Taq protein from E. coli culture, 3) PEI precipitation of Taq protein followed by high-salt wash and dialysis, 4) ion Exchange chromatography purification of Taq protein, 5) ultrafiltration condensing of Taq protein suspension. Verification steps taken to assay Taq protein product concentration and purity and ensure the identity and the correct enzymatic activity were 6) quantifying Taq protein concentration with A280, BCA, Bradford, and Bio-RAD methods, 7) SDS-PAGE molecular weight measurement, 8) gel transfer followed by western blotting verification, and 9) PCR amplification verification with agarose gel electrophoresis ladder labeling of PCR product.
Introduction
Taq DNA polymerase is a protein enzyme produced and utilized by Thermus aquaticus bacterium during binary fission growth. Tomas Brock and Brock Freeze first discovered the bacteria in Yellowstone National Park in 1969 (Brock & Freeze, 1969). As the name implies, Thermus aquaticus inhabits environments of high heat near volcanic hot springs. Specifically, bacteria growth in a high-heat environment implicates the heat tolerance of protein enzymes during DNA replication. This implication has significance in biological science and engineering applications, and three researchers purified the DNA polymerase protein Taq that Thermus aquaticus utilizes for the first time in 1976 (Chien et al., 1976).
Taq DNA polymerase is indispensable in the PCR technique. PCR replicates and amplifies a sequence of DNA by 1) first heat (about 95°C) denaturation separating paired strands of double helix, anti-parallelly bound DNA, 2) then cool annealing each strand with a DNA primer at the desirable starting point of the parent DNA near the 3’ end, 3) and then utilizing Taq DNA polymerase to extend the annealed primer toward the 5’, building the new DNA strand in the 5’ to 3’ direction. The three steps are performed in a bath with sufficient deoxynucleotide phosphates (dNTPs) and repeated with the heating and cooling cycling until the desired amount of replicated DNA material is produced. Taq’s high optimal working temperature of 75°C has not been surpassed by SF and other newly discovered DNA polymerases for withstanding the high heat first step during the repeated heating-cooling cycles (Oscorbin & Filipenko, 2023). Newly discovered thermostable DNA polymerases, such as Tth and Tli, have not surpassed Taq’s replication rate (Thomas & Georrge, 2020). DNA pol I, found in E. coli at an optimal working temperature of 37°C, is generally regarded as destroyed at PCR denaturation step.
For PCR applications, high purity of Taq DNA polymerase is required to reduce the chance of amplifying DNA contaminations. Specifically, Taq DNA polymerase contaminated with the DNA fragments of the host cell cultures, such as E. coli cultures, may amplify the contaminating DNA fragments because the annealing DNA fragments have certain probabilities of annealing onto the contaminants by anti-parallel base pairing. After the PCR cycling amplification, the contaminating DNA may match the molecular weight or length of a DNA sequence of interest, such as an antigen’s coding sequence, a person’s polymorphism short tandem repeat (STR) markers, or an animal species’ immunoglobin coding sequence. A mis-amplified DNA fragment can lead to the misidentification of antigens, resulting in the misdiagnosis of patients in medicine, the misidentification of personnel in criminal forensics, or the misidentification of organisms in habitat studies, resulting in scientific investigation error.
It is difficult to purify and obtain sufficient quantities of Taq protein from its source organism Thermus aquaticus, 1) as the bacteria grow in specific high-heat and pH environments that are not easy to recreate and maintain during all life cycle phases of the bacteria in biochemistry laboratory settings. It has been reported that extremophiles have a slowed growth rate if not grown in optimized pH and other parameters (Parihar & Bagaria, 2019). 2) The second difficulty is that Thermos aquaticus grows by binary fission as a bacterium. Hence, Taq protein is only translated and synthesized for a minimal quantity as a catalytic enzyme in cells during DNA replication when the bacteria divide. The minimal quantity of catalytic enzyme synthesis means that if Thermos aquaticus is used in Taq protein production, the production rate of Taq protein will be pretty low. 3) The third disadvantageous difficulty of purifying Taq protein from Thermus aquaticus, even if the bacteria were grown to sufficient quantity, is that all protein species in the bacteria have high heat tolerance, and heat treatment can not separate Taq protein by denaturation because all proteins are thermostable.
The purpose of this project is to establish a procedure for using E. coli culture in micro-scale, lab environment production of Taq protein, using commercially available materials and verifying and quantifying production. The methods and techniques involved are 1) inducing Taq overexpression in engineered E. Coli bacteria, 2) thermal separation of Taq protein from E. ooli Culture, 3) PEI precipitation of Taq protein followed by high-salt wash and dialysis, 4) ion Exchange chromatography purification of Taq protein, 5) ultrafiltration condensing of Taq protein, 6) quantifying Taq protein concentration, 7) SDS-PAGE verification and gel transfer tests, 8) western blotting verification and PCR tests, and 9) agarose gel electrophoresis laddering of PCR product.
Material And Methods
0.5 L of sterilized Luria Broth (LB) at 25 g/L concentration, pH 7.5, with 0.1 g/L ampicillin was used as the growth medium in this study. Ampicillin was utilized to suppress contaminant bacteria growth. A small volume of the growth medium without E. coli was first tested with 650 nm light, and absorbance was recorded as the background absorption of the medium. The growth medium was then inoculated with 50 mL of engineered E. coli with pAKTaq plasmid as the starting time culture. The 650 nm light absorption was measured for the starting culture for the starting time. The culture flask was incubated at 37°C and shaked in a shaker at 150 rpm. The 650 nm light absorption test was performed every 30 minutes to gauge the growth progress.
When the absorbance reached 0.4, with background absorbance discounted, the growth medium was given the IPTG reagent treatment at the concentration of 0.5 mmol/L to induce the expression of Taq protein. The culture medium was returned to incubation at the same temperature and shaking rpm to continue the growth of E. coli and synthesis of Taq protein overnight.
The next morning, the absorbance of the growth medium was measured for the last time. The growth culture was evenly divided into 2 centrifugation bottles in a Sorvall GSA rotor and centrifuged at 5800 g for 20 minutes at 4°C. The supernatant fluid was discarded after centrifugation; the E. coli precipitate was stored at -20°C.
HEPES solution was prepared at 50 mM, pH 7.9; Buffer A was prepared at pH 7.9 as a mixture of 50 mM Tris, 50 mM dextrose, and 1 mM EDTA; Buffer B was prepared at pH 7.9 as a mixture of 10 mM Tris, 50 mM KCl, 1 mM EDTA, 0.5% Tween20.
The 2 E. coli pellets in 2 centrifuge bottles were thawed at room temperature for 10 minutes, then each was resuspended, homogenously, in 30 mL of a cleaning solution, which was a mixture of Tris (pH 7.9) at 50 mM, dextrose at 50 mM, and EDTA at 1 mM. The resuspended cultures were centrifuged at 7600 g, 4°C, with an SS-34 rotor, for 10 minutes, to obtain cleansed E. coli as pellets. The supernatant was discarded.
The cleansed E. coli pellet in each centrifuge bottle was gently resuspended in 10 mL of bacterial lysis solution, which was a mixture of Tris at 45 mM, dextrose at 45 mM, EDTA at 0.9 mM, and lysozyme at 0.4 mg/mL, incubated at 25°C for 15 minutes.
After cell lysis, each bottle was resuspended again in 10 mL of a mixture of Tris, pH 7.9, at 10 mM, KCl at 50 mM, EDTA at 1 mM, Tween 20 at 0.5 %, and PMSF at 2 mM. PMSF inhibited protease activities for thermal separation.
The thermal separation was performed immediately with a water bath at 75 °C for 30 minutes followed by centrifugation at 7600 g, 4°C, with a SS-34 rotor, for 15 minutes. The resulting supernatant, containing Taq protein, was filtered through a Kimwipe filter and stored at -4°C.
Buffer C1 was prepared as a mixture of 20 mM Hepes at pH 7.9, 1 mM EDTA, 0.5% Tween 20, and 0.15 M KCl.
The Taq protein suspension was thawed at 25°C and given PEI (polyethylenimine) polymer to form a 0.15% PEI fluid. After gentle mixing, the suspension was incubated on ice for 10 minutes then separated into two 50 mL centrifugation bottles and centrifuged at 7600 g, 4°C, with an SS-34 rotor, for 20 minutes, to obtain condensed Taq protein in PEI polymer as pellets. The supernatant was discarded.
Salt-in procedure was performed for each of the 2 bottles of Taq protein pellets to resuspend Taq protein while trapping DNA, RNA, and other charged molecules in PEI. The salt-in solution was a volume of 5 mL of Buffer C1, a mixture of 20 mM HEPES (pH 7.9), 1 mM of EDTA, 0.5% Tween 20, and 0.15 M KCl, with PMSF at 2.0 mM, for each of the 2 Taq protein pellets. The PMSF, again, was utilized as an anti-protease to prevent Taq degradation. The Taq protein pellets with PEI polymer were thoroughly mixed with the salt-in solution and then centrifuged same as before, condensing PEI polymer with trapped DNA, RNA, and other charged molecules as pellets, keeping Taq protein suspended in solution.
Buffer C2 was prepared as a dialysis solution as a mixture of 20 mM Hepes at pH 7.9, 1 mM EDTA, and 0.05 M KCl.
The resuspended Taq protein was transferred to a dialysis tube and given dialysis overnight in a 4-liter bath of Buffer C2. The temperature during dialysis was 4°C.
The dialyzed Taq protein suspension fluid was stored at -20°C after 12 hours of dialysis.
A 15 mL volume of fine-grain, wetted CM-Sephadex ion exchange beads was prepared with buffer C2, a mixture of 0.05 M KCL, 20 mM Hepes (pH 7.9), and 1 mM EDTA.
The previous dialyzed Taq protein suspension was thawed in hands and then added to the 15 mL CM-Sephadex column for ion exchange binding in a vortex tube. The vortex tube was incubated on a rocker for 60 minutes at 4°C. Then, it was centrifugated with an HS-4 rotor at 1200 G, 4°C, for 5 minutes to complete the binding.
After the centrifugation binding, the volume was rested for 1 minute to allow the supernatant above the bead column to clear, and then the supernatant was suctioned out and discarded. The bead column was gently quenched with low salt wash buffer C2, KCl at 0.05 M, 20 mM Hepes (pH 7.9), and 1 mM EDTA, reaching 45 mL in volume with PMSF at 1 mM, to elute non-Taq proteins and other impurity molecules. Then the vortex tube was incubated on a rocker for 30 minutes at 4°C, then centrifugated the same as before to complete the separation of elution of impurities into the supernatant.
After the centrifugation, the volume rested the same as before, and the supernatant was discarded.
To elute Taq protein, the ion exchange column was gently quenched with high salt buffer C3, KCl at 0.2 M, 20 mM Hepes (pH 7.9), and 1 mM EDTA, reaching 45 mL in volume with PMSF at 1 mM. The column was rocked the same as before to complete the elution. Then the column was filtered with a layer of Kimwipe to remove the used ion exchange beads. The fluid that passed the filtration containing Taq protein was collected and stored at -20°C. The used beads were discarded.
75 μL of Taq protein product was loaded with 25 μL of 4X SDS-PAGE (sodium dodecyl sulfate-polyacrylamide gel electrophoresis) loading reagent mixture, which was composed of SDS, methylene blue, glycerol, and β-mercaptoethanol. 5 μL commercial Taq protein diluted with 13 μL 1X TBS buffer was loaded with 6 μL of the same 4X loading reagent mixture. Both product Taq protein and commercial Taq protein were heated to 95°C for 5 minutes to fully denature Taq protein and bind SDA to Taq protein.
A 10-lane preformed commercial polyacrylamide electrophoresis gel pack was used. Each half gel (with 5 lanes) had the lanes loaded, from left to right, with 10 μL commercial protein ladder, 10 μL of denatured commercial Taq protein solution, 10 μL of denatured Taq product solution, and 20 μL of denatured Taq product solution. The electrophoresis was loaded with sufficient buffer and ran at 250 volts for 25 minutes, positive pole at the far end from the loaded wells. Then the gel was cut in half, with 5 lanes on each half. The first half was submerged and washed with deionized water on an orbital shaker for 10 minutes, refreshed with new deionized water, and repeated the washing 2 times, then drained of water and submerged in Coomassie Brilliant Blue R-250 dye and shaken in the orbital shaker for 60 minutes. Then it was photographed with a ruler with white fluorescent light for molecular weight calculation.
The other half gel was sandwiched with a piece of nitrocellulose, 2 pieces of Whatman paper, and 2 pieces of sponge into a transfer sandwich holder and inserted into the transfer apparatus. The gel and nitrocellulose were the innermost layers, gel toward the negative pole, nitrocellulose toward the positive pole, then Whatman paper, and then the sponge on the outermost layer in the transfer sandwich. The transfer apparatus was loaded with a compartment of water ice, sufficient transfer buffer, and a stir rod. The transfer was performed on a stirring plate to allow the stir rod to circulate the fluid and cool the bath. The transfer apparatus was electrified to run for 1 hour at 60 volts. The nitrocellulose with protein transferred was saved in Saran wrap for further western blotting.
An ultrafilter with a molecular weight 30 kDa cut-off rating was utilized with centrifugation in an HS-4 rotor, 2300 G, at 4C, to decrease the Taq protein solution volume to 1 m.
Results
The E. coli growth culture reached a 0.4 absorbance of 650 nm light after 3 hours of growth at 37°C and good aeration. The culture solution gradually turned from light yellow to dark yellow over the 21-hour incubation period with Taq protein production. The centrifugation precipitated E. coli cells into pellets.
In Figure 1 below, the recorded time (horizontal axis) with 650 nm light absorbance (vertical axis) of the E. coli culture, discounting the background absorbance, was plotted. The absorbance ranged from 0.063 to 0.432 in the first 3 hours of growth and reached 1.019 at 21 hours.
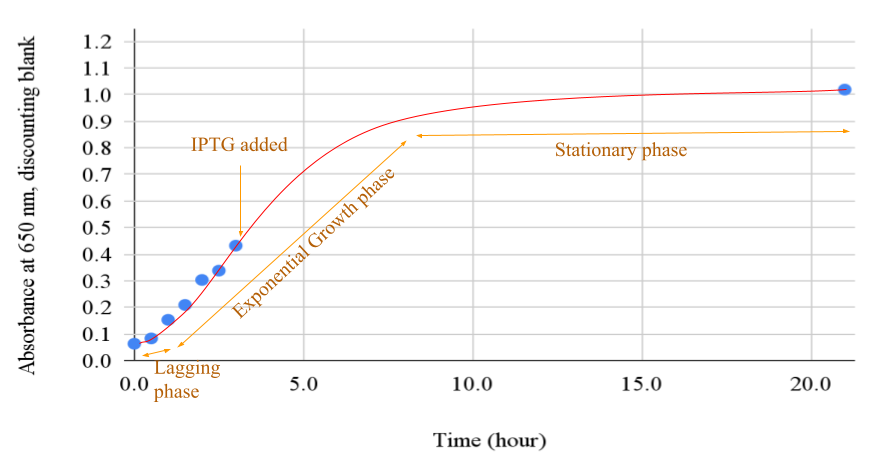
Figure 1. Plot of absorbance of growth culture over time
Legend: The growth curve had 3 distinct phases. Near the starting point, the slope was moderate, marked as the lagging phase. An exponential growth followed from hour 1 onward, marked as the exponential growth phase. IPTG was added in the middle of the exponential growth. The growth slowed after hour 8 and became nearly a flat line near the end of the stationary phase.
The cell lysis extraction of Taq protein was done using the preparation, cleansing, and lysis procedure of E. coli pellets, followed by centrifugation. The thermal separation of Taq protein from E. coli proteins was performed, with debris proteins forming a white coagulation at the bottom quarter of the centrifugation column and discarded.
The PEI (polyethylenimine) chromatography procedure precipitated Taq protein, followed by high-salt elution resuspension and dialysis, which brought the salt concentration to about 0.05M KCl. PMSF was added to prevent protein degradation in all purification steps.
The ion exchange purification binding was done with CM-Sephadex resin beads under a gentle rocker motion. The removal of contaminants with a low-salt wash and elution of Taq protein with a high-salt buffer was also done with the gentle rocker motion.
The ultrafilter with a molecular weight 30 kDa cut-off rating decreased the Taq protein solution volume to 1 mL. Overall, the concentration estimates between all 4 different assay methods were shown in the following Table 1.
Table 1. Produced Taq Protein Concentration Estimation
Caption: Each of the estimated concentrations, except the NanoDrop, is the average of the assay result calculations of 2 samples for each assay method.
For molecular weight verification of product Taq protein, the Taq protein product was loaded into SDS-PAGE electrophoresis and allowed to migrate in the gel. There was no breakage or damage during gel cutting. Transferring of migrated protein onto nitrocellulose was completed as timed. As shown in Figure 2 below, the Taq protein product samples traveled 2.2 cm in the gel after the SDS-PAGE, while the commercial Taq protein traveled 2.1 cm.
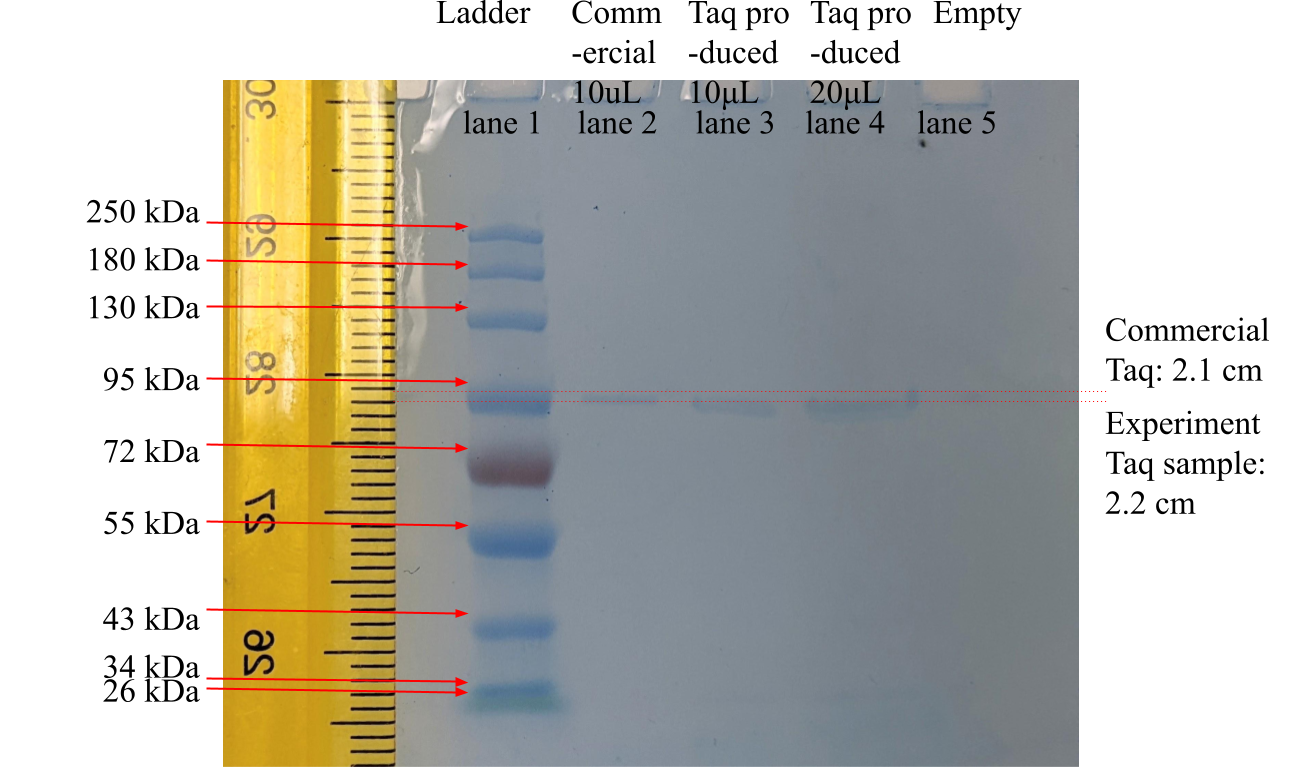
Figure 2. SDS-PAGE Test Result Of Taq DNA Polymerase Samples
Legend: The leftmost lane, marked “Ladder,” was a commercial marker proteins, ranging, from top to bottom, between 250 kDa to 25 kDa molecular weight. The second lane from the left, marked “Commercial,” was commercial Taq protein. The third and fourth lanes were this study’s experiment product samples of 10 μL and 20 μL, respectively. The ruler was graduated by 1 mm with centimeter numbering.
In Figure 2, the inverse logarithm interpolated molecular weights of the product Taq protein of 10 μL and 20 μL (in lanes 3 and 4) were both 97 kDa and 103 kDa for the commercial Taq protein (in lane 2).
The nitrocellulose membrane was given milk power protein binding with a gentle rocker motion for about 18 hours. The primary and secondary immunoglobulin bindings with anti-Taq mice IgG and anti-mice goat IgG (conjugated with horseradish peroxidase) were also performed with the gentle rocker motion and timed according to the timing schedule. Washing was performed between the three binding processes as required. Peroxide and luminol were added accordingly before the Western blot result was photographed after the last binding and washing, as shown in Figure 3. Lane 1 had no light bands. The commercial Taq protein in lane 2 and this experiment’s protein product in lane 3 and lane 4 each had one single band of light. Lane 4’s light band was more intense than lane 3’s. All the light bands were at the same height level.
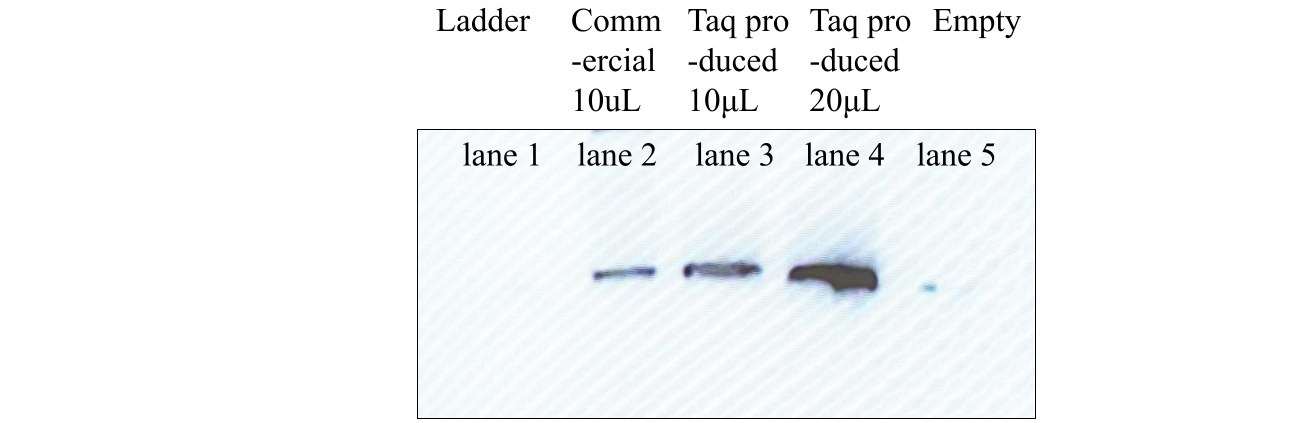
Figure 3. Western Blot Result Of Taq DNA Polymerase Samples
Legend: The leftmost lane, marked “Ladder,” was with commercial marker protein mixture. The second lane from the left, marked “Commercial,” was with commercial Taq protein. The third and fourth lanes were this study’s experiment product samples of 10 μL and 20 μL, respectively.
For PCR enzymatic activity verification, the PCR heat cycling machine performed the amplification of a known 750 bps DNA template in the 3 PCR reaction Eppendorf tubes (except the negative control tube). Agarose gel electrophoresis was performed with 15 μL of the content from each of the 3 PCR reaction tubes in separate lanes.
The PCR amplification product electrophoresis gel photograph was shown in Figure 4 with UV illumination. The DNA ladder lane, marked “Ladder,” had 10 fluorescence bands of DNA of known length, ranging from 1517 bps to 300 bps, as labeled in Figure 4. Lane 1 with commercial Taq protein and 10 ng of DNA template, 750 bps long, produced a fluorescence band of DNA, about 740 bps by migration distance interpolation. Lane 2 had no fluorescence bands. Lane 3, with product Taq protein and 10 ng of DNA template, 750 bps long, also produced a fluorescence band of DNA, about 790 bps by migration distance interpolation. Lane 1’s fluorescence was more intense than lane 3’s.
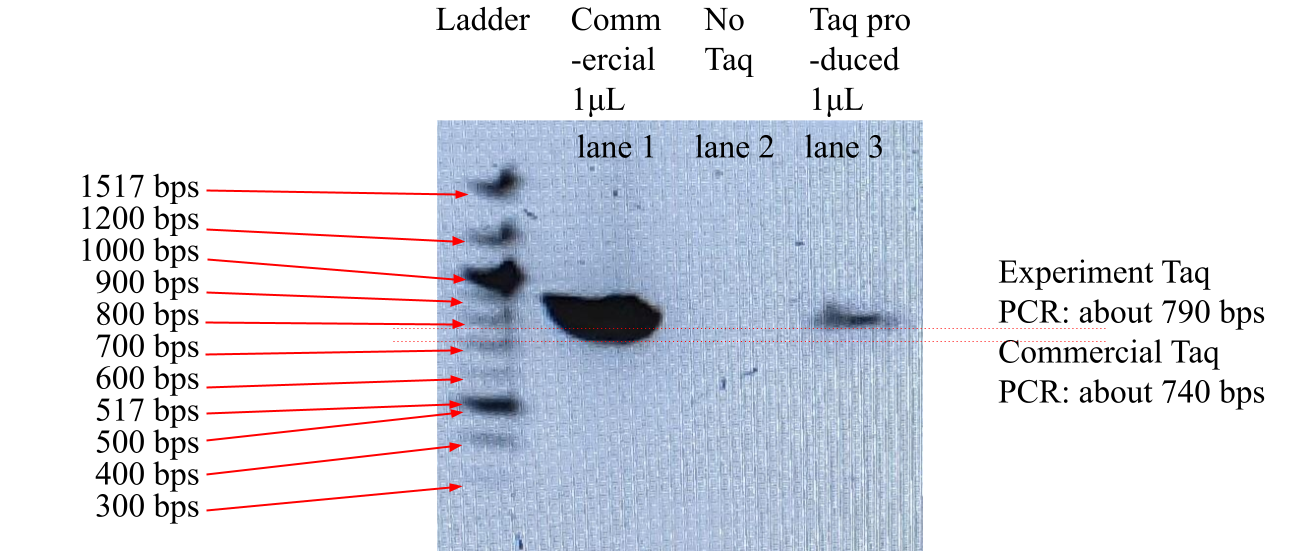
Figure 4. PCR Amplification Result Of 750 bps DNA template with Taq Protein Samples
Legend: The leftmost lane, marked “Ladder,” was with commercial marker known-size DNA mixture. Lane 1 included 1μL of commercial Taq protein. Lane 3 included 1μL of Taq protein produced by this experiment. Lanes 1 and 3 each included 10 ng of DNA template, 750 bps long, in 1 μL volume. Lane 2 did not contain any Taq protein or DNA template. The photo was taken with a digital imager under UV light.
Discussion
The overexpression of Taq protein by the IPTG transcription switch at the exponential growth phase, at 3 hours of growth and 0.43 650 nm light absorbance, as seen in Figure 1, likely contributed to the high product yield of this experiment. If the IPTG transcript switch was turned on earlier before E. coli culture had vigorous growth, the Taq expression yield would likely lower due to the low cell count. And, if the IPTG transcript switch were turned on too late when the culture was metabolic stagnation due to waste accumulation, the product yield would also likely be lower. The heat separation of the Taq protein product likely contributed to the bulk removal of non-Taq, E. coli cell debris (Engelke, 1990). This is due to the large temperature difference of denaturation and precipitation. The heat separation purification was indispensable. The PEI chromatography contributed greatly to the removal of contaminant DNA by using a buffer at pH 7.9 against Taq’s isoelectric point (pI) 6.0 (Kim, 2014), which allowed high-salt selective solubilizing of Taq protein. And dialysis brought the salt concentration down to about 0.05M KCl. The CM-Sephadex resin beads ion exchange chromatography also contributed to the removal of contaminant DNA by the local, partial positive charges of Taq protein residuals, which contaminant DNA lacked locally positively charged chemical groups. The ultrafiltration reduced the concentration of small molecule contaminants and increased the final product’s concentration.
The 4 different protein concentration estimation methods on the produced Taq protein showed the Taq concentration between 0.084 and 0.228 mg/mL. The NanoDrop and BCA assays had similar concentration estimates between 0.125 and 0.150 mg/mL. The Bradford assay had the lowest estimation of 0.084 mg/mL, possibly a low-end outlier; the Bio-Rad DC assay had the highest estimation of 0.228 mg/mL, possibly a high-end outlier. The average among the 4 different assays for the Taq protein concentration was 0.147 mg/mL.
The NanoDrop assay with light absorbance at 280 nm is known to overestimate the concentration of protein in solution if the sample was contaminated with aromatic molecular rings of nucleic acid molecules (Olson, 2012). Aromatic molecular rings in other contaminants that absorb light at 280 nm can also lead to overestimation (Zagriadskaia, 2024). Underestimation can occur with proteins deficient in aromatic rings of tyrosine and tryptophan (Zagriadskaia, 2024). However, this study performed Ion Exchange filtration to eliminate nucleic acid contaminants by selecting local positive charges of Taq, so the NanoDrop assay’s estimated Taq protein concentration of 0.125 mg/mL was likely accurate.
The BCA assay is known to be sensitive to protein concentrations between 0.005 and 1 mg/mL (Walker, 2009). However, tyrosine, tryptophan, and cysteine residues can reduce copper(II) ions in the first step of the Buiret reaction, in addition to the peptide bonds intended to reduce copper(II) ions, leading to overestimation of concentration of 1) proteins rich in the said 3 amino acid residues or 2) sample solutions with reducing agents (Zagriadskaia, 2024). However, Taq protein’s tyrosine, tryptophan, and cysteine contents are not particularly high, so the BCA assay’s estimated Taq protein concentration of 0.150 mg/mL was likely accurate.
However, the Bradford assay’s Coomassie Brilliant Blue dye binds to aromatic residues of proteins. The dye is known to be incompatible with 1) detergents and 2) other contaminants, and it binds to both 3) basic and 4) aromatic amino residues leading to overestimation of concentrations of proteins rich in positively charged or aromatic residues (Zagriadskaia, 2024). However, Taq protein is known to be acidic with a net negative charge at physiological pH. As the low-end outlier, the Bradford assay possibly underestimated the Taq protein concentration.
The Lowry Bio-Rad DC assay uses the same first-step reaction as the BCA assay, which tends to enhance copper(II) reduction with tyrosine, tryptophan, and cysteine residues. It has the same 3 undesirable assay samples as the BCA assay, namely 1) proteins overly rich in the said 3 amino acid residues and 2) sample solutions with reducing agents. However, Bio-Rad DC assay’s second step Folin-Ciocalteu reagent, can also react with 3) tyrosine, tryptophan, or cysteine residue-rich proteins, leading to an additional overestimation of Taq protein concentration (Zagriadskaia, 2024). As the high-end outlier, the Bio-Rad DC assay possibly overestimated the Taq protein concentration.
During this study's first centrifugation, the loss of nearly half of the entire E. Coli culture with Taq protein already expressed likely reduced the product protein suspension concentration. If the experiment is repeated in a future study without centrifugation bottle failure, the concentration measures with all four different concentration assays will likely double to approximately 0.3 mg/mL.
For SDS-PAGE molecular weight assay, in Figure 2, the interpolated molecular weight of 97 kDa of the product Taq protein (in lanes 3 and 4) and 103 kDa of the commercial Taq protein (in lane 2) were slightly different from the well-known value of 94 kDa of full-length Taq Pol I (Lawyer, 1989). However, compensating for the slanted electrophoresis travels of the ladder and commercial lanes, the more to the right of the gel, the lower and further the migration distance; the product sample Taq protein was likely the well-known Taq protein’s 94 kDa molecular weight because no other molecules in the 2 samples migrated for nearly the same distance the commercial Taq protein and the closest standard ladder protein had 95 kDa molecular weight. The possible source of the slanted protein migration line was the concaved electrical current front line during electrophoresis. The molecules near the center of the gel plate were often pulled harder by stronger electrical current than molecules on the sides (lane 1 and lane 10) of the gel plate.
SDS-PAGE separates different species of proteins by molecular weight. The SDS-PAGE test in this study directly interpolated the molecular weight information of a sample protein product and indirectly inferred its purity. If contaminant proteins of different molecular weights were present, multiple bands of protein migration would have appeared in the SDS-PAGE gel. In each of Figure 3’s Taq sample lanes of this study’s experiment product, there was only 1 single band of protein, which meant the samples were high-purity and free from other contaminant proteins. Hence, the product of this study experiment was likely pure Taq DNA polymerase.
The Western blotting result in Figure 3 showed no bands of chemiluminescence in lane 1, lane 2 had a single band of chemiluminescence light, and lanes 3 and 4 also had a single band of chemiluminescence light in each lane. Specifically, lane 3 or lane 4’s light band was at the same height level as lane 2’s with commercial Taq protein.
As expected, lane 1 of Figure 3 was devoid of bands of chemiluminescence with only non-Taq ladder proteins. As expected, with a commercial Taq protein product as a positive control in lane 2, the lane had a single band of chemiluminescence with Taq-specific immunoglobin binding and luminol oxidation reaction. Lanes 3 and 4, with this experiment’s Taq protein product, also had a single band of chemiluminescence in each lane, as expected.
As expected, lane 4, with twice the Taq protein product quantity than lane 3, had a higher chemiluminescence intensity in digital photography than lane 3, proportional to the amount of luminol oxidation activity.
Western blotting identifies protein species by protein epitope-specific immunoglobin binding and distinguishing compatible-epitope-binding protein species by molecular weight with SDS-PAGE migration distance. This experiment’s protein product’s chemiluminescence at the same SDS-PAGE migration distance as the chemiluminescence band with commercial Taq protein implicated the same immunoglobin binding to this experiment’s product protein, which was Taq protein-specific in this experiment and with the same molecular weight. The purified protein product produced by this experiment was hence verified as Taq DNA polymerase protein.
Gel electrophoresis of DNA samples identifies amplified DNA molecules by fluorescence band migration distances. As shown in Figure 3, lane 3, which contained 750 bps DNA template amplified by this experiment’s Taq protein enzyme, had an electrophoresis migration distance roughly equivalent to 790 bps DNA molecules’ travel distance. Lane 1 of Figure 1, which contained 750 bps DNA template amplified by this experiment’s Taq protein enzyme, had an electrophoresis migration distance roughly equivalent to 740 bps DNA molecules’ travel distance. The 2 migration distances are slightly higher and lower than the known 750 bps DNA template’s migration distance. Judging by the concave band lines in the gel in Figure 3, it was determined that the true travel distance of both lane 1 and lane 3’s DNA matched the expected travel distance for 750 bps DNA template. In Figure 3, lane 3’s DNA fluorescence is more intense than lane 1’s due to the loss of nearly half of the entire E. Coli culture with Taq protein already expressed in this study's first centrifugation with bottle breakage that reduced the production concentration. If the experiment was to be repeated in a future study without centrifugation bottle failure, the concentration of Taq produced would likely double, and lane 3’s DNA fluorescence would be of the same intensity as lane 1’s. As a negative control, lane 2’s absence of any DNA fluorescence band signifies that the gel electrophoresis and PCR reaction tubes were not contaminated with any DNA molecules. This meant that lane 1 and lane 3 DNA molecules were amplified by the enzymatic activities of commercial Taq protein and this experiment’s Taq protein product, respectively. Furthermore, lane 3’s DNA product amplified by this experiment Taq protein had the same length as the control lane 1’s DNA product, meaning that the enzymatic activity of this experiment Taq protein was the same as commercial Taq protein. The purified Taq DNA polymerase protein produced by this experiment was hence verified as enzymatically active.
Furthermore, Figure 4’s single, clear lane of 750 bps DNA in lane 3 with this experiment’s Taq protein suspension solution signifies that the suspension solution of this study’s production was free of DNA contaminants, which is crucial in PCR applications that can not tolerate DNA contaminants.
Overall, this experiment study’s goal was achieved with the production of a 1 mL suspension of Taq DNA polymerase at a 0.15 mg/mL concentration with good enzymatic activities and appropriate for PCR utilities. The identity of the product was verified as Taq protein by Taq-specific immunoglobulin tagging in western blotting, and the molecular weight was correct at 94 kDa in SDS-PAGE. The only possible improvement for increasing product concentration was enhancing the robustness of centrifugation bottles subjected to 5800 G force, which would increase the product quantity. The only possible improvement for time and labor saving is to either skip the PEI precipitation step or the CM-Sephadex ion exchange because either step removes contaminant DNA. However, to produce the highest purity of product, both PEI precipitation and CM-Sephadex ion exchange may be required in further studies.
References
Engelke, D. R., Krikos, A., Bruck, M. E., & D Ginsburg. (1990). Purification of Thermus aquaticus DNA polymerase expressed in Escherichia coli. Analytical biochemistry, 191(2), 396-400.
Kim, S. G., & Park, J. T. (2014). Production of DNA polymerase from Thermus aquaticus in recombinant Escherichia coli. Korean Journal of Agricultural Science, 41(3), 245-249.
Lawyer, F. C., Stoffel, S., Saiki, R. K., Myambo, K., Drummond, R., & Gelfand, D. H. (1989). Isolation, characterization, and expression in Escherichia coli of the DNA polymerase gene from Thermus aquaticus. Journal of Biological Chemistry, 264(11), 6427-6437.
Olson, N. D., & Morrow, J. B. (2012). DNA extract characterization process for microbial detection methods development and validation. BMC research notes, 5, 1-14.
Walker, J. M. (2009). The bicinchoninic acid (BCA) assay for protein quantitation. The protein protocols handbook, 11-15.
Zagriadskaia, E. (2024). BIOCHEMISTRY TECHNIQUES BIOL 4210L/5210L Spring 2024. Umassonline.net. https://lowell.umassonline.net/bbcswebdav/pid-2666023-dt-content-rid-28390199_1/xid-28390199_1
No comments:
Post a Comment